지난해 말, 지인 한 명이 이런 말을 했어요. “주식은 너무 무섭고, 예금은 이자가 너무 낮고, 그렇다고 코인은 자신 없는데… 도대체 어디에 넣어야 하냐”고요. 그 고민, 사실 많은 분들이 공감하실 거라 봅니다. 2026년 현재, 글로벌 인플레이션 압력이 여전히 남아 있고, 미국 연준(Fed)의 금리 경로에 대한 불확실성도 가시지 않은 상황이에요. 이런 환경에서 조용히 주목받고 있는 게 바로 원자재(Commodity) 기반 포트폴리오입니다. 특히 금(Gold), 원유(Crude Oil), 구리(Copper)는 각자 다른 경제적 역할을 하기 때문에, 세 가지를 조합하면 꽤 흥미로운 분산 효과를 기대할 수 있어요. 오늘은 이 세 가지 원자재를 어떻게 포트폴리오에 담을 수 있는지 함께 살펴보겠습니다.
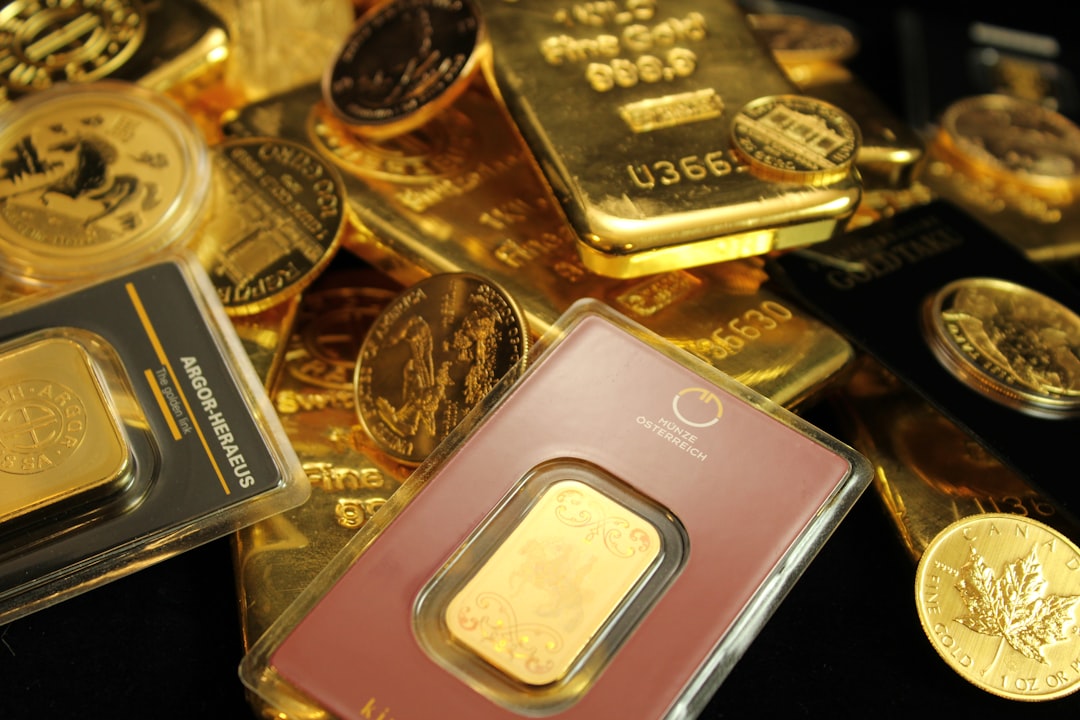
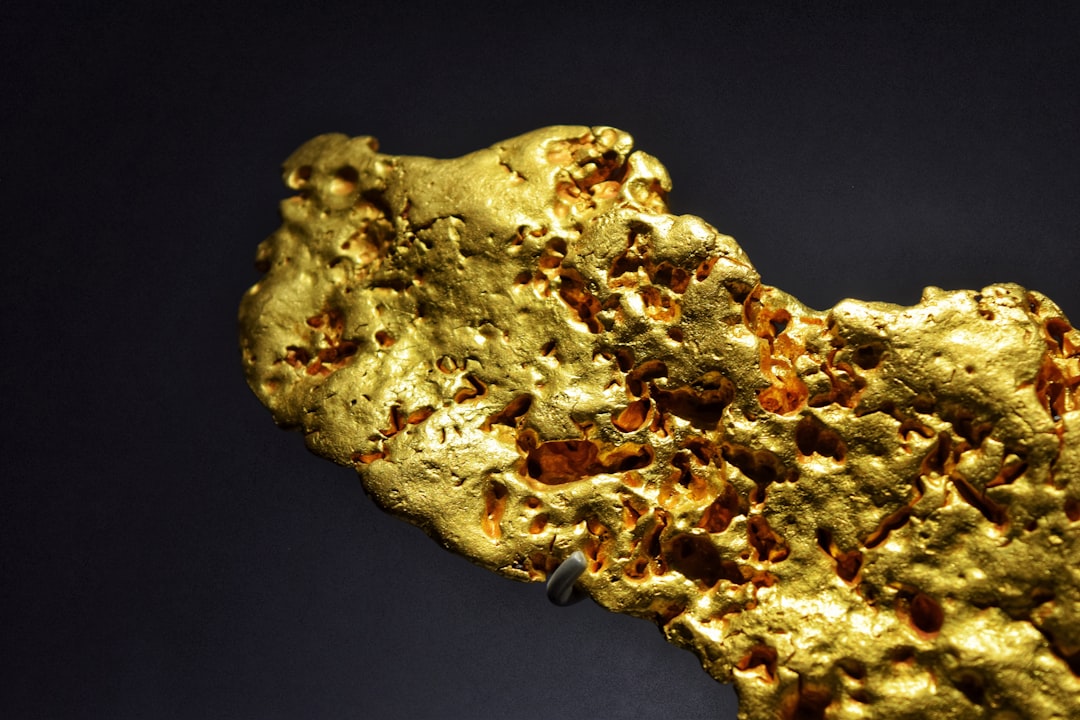
① 금(Gold): 인플레이션과 공포의 피난처
금은 오랫동안 ‘안전자산’의 대명사로 불려왔어요. 2026년 3월 현재 국제 금 가격은 트로이온스당 약 2,900~3,100달러 선에서 형성되어 있는 것으로 파악됩니다. 2020년 초와 비교하면 두 배 가까이 오른 셈이에요.
금이 오르는 구조를 단순화하면 이렇습니다. 실질금리(명목금리 – 인플레이션)가 낮거나 마이너스일 때, 이자를 주지 않는 금의 기회비용이 줄어들어 매력이 높아지는 거예요. 또한 달러 약세 국면에서도 금은 강세를 보이는 경향이 있습니다. 포트폴리오 전체에서 10~15% 수준으로 배분하는 게 일반적으로 권장되는 비중이라고 봅니다.
투자 방법: 금 ETF(예: SPDR Gold Shares, 국내 KRX 금 시장), 금 통장, 실물 골드바
장점: 주식 및 채권과 상관관계가 낮아 분산 효과 탁월
단점: 배당이나 이자 수익 없음, 보관비용 발생(실물의 경우)
② 원유(Crude Oil): 경기 사이클의 바로미터
원유는 금과는 성격이 꽤 달라요. 원유는 경기 민감형 자산에 가깝습니다. 경기가 좋아지면 산업 활동과 이동량이 늘면서 수요가 증가하고 유가가 오르는 구조예요. 반대로 경기 침체기에는 급락하는 특성도 있죠.
2026년 현재 WTI(서부텍사스산 원유) 기준으로 배럴당 70~85달러 수준에서 등락하고 있는 것으로 파악됩니다. OPEC+의 감산 기조와 미국 셰일오일 생산량 변화, 중동 지정학적 리스크가 복잡하게 얽혀 있어 단기 변동성이 큰 편이에요. 이 때문에 원유는 전체 포트폴리오의 5~10% 이내로 제한하는 게 리스크 관리 측면에서 합리적이라고 봅니다.
투자 방법: 원유 ETF(예: USO, 국내 KODEX WTI원유선물(H)), 에너지 섹터 주식(엑슨모빌, 쉐브론 등)
장점: 인플레이션 헤지 기능, 지정학적 이벤트 시 수혜 가능
단점: 선물 기반 ETF의 롤오버(Roll-over) 비용 발생, 변동성 매우 높음
③ 구리(Copper): ‘닥터 코퍼’가 알려주는 미래 경제
구리는 월가에서 ‘닥터 코퍼(Dr. Copper)’라는 별명으로 불려요. 경제학 박사처럼 경기를 정확히 진단한다는 의미입니다. 전기차 배터리, 태양광 패널, 반도체 설비 등 탄소중립 관련 산업에 구리 수요가 집중되면서, 2026년 현재 구리는 단순한 경기 지표를 넘어 에너지 전환(Energy Transition)의 핵심 원자재로 재평가받고 있어요.
현재 LME(런던금속거래소) 기준 구리 가격은 톤당 약 9,500~10,500달러 수준인 것으로 파악됩니다. 국제에너지기구(IEA) 보고서에 따르면, 2030년까지 탄소중립 목표 달성을 위해 현재보다 훨씬 많은 구리 공급이 필요한데, 채굴 인프라 확장이 이를 따라가지 못하는 ‘구조적 공급 부족’ 리스크가 있다는 분석이 나오고 있어요. 포트폴리오 내 5~10% 배분을 고려해볼 수 있습니다.
투자 방법: 구리 ETF(예: CPER, Global X Copper Miners ETF), 구리 채굴 기업 주식(프리포트-맥모란 등)
장점: 에너지 전환 구조적 수요, 경기 회복 시 강한 상승 탄력
단점: 중국 경기 의존도 높음, 광산 관련 규제 리스크
세 가지를 어떻게 조합할까? — 실전 포트폴리오 예시
국내외 사례를 보면, 레이 달리오(Ray Dalio)의 브리지워터가 제안한 ‘올웨더 포트폴리오(All-Weather Portfolio)’에서도 원자재는 전체의 약 7.5% 수준으로 포함되어 있어요. 물론 개인 투자자가 그대로 따라갈 필요는 없지만, 원자재를 하나의 독립된 자산군으로 인식하는 시각은 참고할 만하다고 봅니다.
국내에서도 2025년 이후 원자재 ETF 거래량이 눈에 띄게 늘었어요. 한국거래소(KRX) 통계에 따르면 금·원유 관련 ETF의 월 평균 거래대금이 전년 대비 30% 이상 증가한 것으로 알려져 있습니다. 이는 개인 투자자들 사이에서도 원자재 분산투자에 대한 관심이 실질적으로 높아졌다는 신호라고 볼 수 있어요.
아래는 보수적·중립적 투자 성향에 따른 간단한 배분 예시입니다:
[보수적 투자자] 금 15% / 원유 5% / 구리 5% → 원자재 합계 25%, 나머지는 채권·예금
[중립적 투자자] 금 10% / 원유 8% / 구리 7% → 원자재 합계 25%, 나머지는 주식·채권 혼합
[적극적 투자자] 금 10% / 원유 10% / 구리 10% → 원자재 합계 30%, 나머지는 성장주·테마 ETF
꼭 알아야 할 리스크 체크리스트
원자재는 달러로 거래되므로 환율 리스크(원/달러 변동)를 반드시 고려해야 해요
선물 기반 ETF는 콘탱고(Contango) 현상으로 인해 현물 가격과 수익률이 다를 수 있어요
원자재는 주식처럼 기업 이익이 반영되지 않으므로 순수 가격 변동에만 의존한다는 점을 인식해야 해요
국내 원자재 ETF는 세금 구조(배당소득세 vs. 매매차익 과세)가 상품마다 다를 수 있으니 가입 전 확인이 필요합니다
에디터 코멘트 : 금·원유·구리는 각각 ‘안전’, ‘경기’, ‘미래’라는 서로 다른 이야기를 하는 자산이에요. 세 가지를 한꺼번에 담는다는 건, 어느 한 방향의 경제 시나리오에 올인하지 않겠다는 선언이기도 합니다. 물론 원자재 투자가 만능 해결책은 아니에요. 하지만 주식 하락장에서 포트폴리오가 완전히 무너지는 경험을 한 번이라도 해보셨다면, 이 세 자산의 조용한 존재감이 얼마나 소중한지 느끼실 수 있을 거라 봐요. 중요한 건 ‘얼마를 투자하느냐’보다 ‘왜 이 비중으로 구성했는지’ 스스로 납득할 수 있느냐 입니다. 그 납득이 흔들리지 않는 장기 투자의 출발점이 되거든요.
Let me paint a picture for you. It’s early 2026, and a friend of mine — a graphic designer with zero finance background — called me excitedly after watching a YouTube video about crude oil futures. ‘I put $2,000 into a leveraged oil contract,’ she said. Three days later, she lost 60% of it. Not because she was careless. She just didn’t understand the machinery underneath commodity futures investing. That call is exactly why I’m writing this guide today.
So, let’s think through this together — carefully, practically, and without the hype.
What Exactly Are Commodity Futures? (And Why They’re Not Like Stocks)
A commodity future is a legally binding contract to buy or sell a specific quantity of a raw material — crude oil, gold, wheat, copper, natural gas — at a predetermined price on a future date. Unlike buying Apple stock, you’re not purchasing ownership in a company. You’re making a bet (or a hedge) on where a physical resource’s price will go.
Here’s the key mechanic that trips beginners up: leverage. Most commodity futures accounts allow you to control a large contract with a relatively small deposit called margin. On the CME (Chicago Mercantile Exchange), a single WTI crude oil contract represents 1,000 barrels. At roughly $78/barrel (as of early 2026 pricing trends), that’s $78,000 worth of oil — but your margin requirement might be as low as $5,000–$7,000. That’s 10x–15x leverage baked right in.
This is thrilling when you’re right. It’s devastating when you’re not.
The 2026 Commodity Landscape: What Data Tells Us
Let’s look at where we actually stand. The commodity markets in 2026 are shaped by several overlapping forces:
Energy transition pressure: Crude oil demand has plateaued in developed markets, but emerging economies in Southeast Asia and Africa are still driving consumption. Brent crude has been trading in a volatile $72–$88 band in early 2026.
Gold’s continued role as a safe haven: Gold crossed $2,800/oz in late 2025 and has maintained elevated levels through Q1 2026, driven by central bank accumulation (especially from China and India) and persistent geopolitical uncertainty.
Agricultural volatility: Wheat and corn futures have seen sharp swings due to El Niño-related weather disruptions in key growing regions, making agricultural futures particularly high-risk for beginners.
Copper as a “green metal” play: With EV infrastructure buildout accelerating globally, copper futures have attracted significant institutional interest — a trend worth watching in 2026.
Natural gas pricing divergence: U.S. Henry Hub prices remain moderate, while European TTF gas prices stay structurally higher due to ongoing energy policy shifts post-Ukraine conflict resolution negotiations.
Real-World Examples: How Investors Are Navigating This in 2026
Let’s look at two contrasting approaches from real market participants this year.
Example 1 — South Korean retail investors (domestic): Korea’s Financial Supervisory Service reported a 34% increase in retail participation in commodity ETFs (not direct futures) between 2024 and early 2026. Many Korean investors, burned by the crypto volatility of 2023-2024, shifted toward gold and oil ETFs as a “tangible” alternative. The lesson? Most savvy retail investors are accessing commodity exposure through ETFs and ETNs, not raw futures contracts.
Example 2 — U.S. institutional trend in 2026: Major hedge funds like Citadel and Bridgewater have reportedly increased their commodity allocations to 12–15% of portfolios in 2026, hedging against what they see as a new commodity supercycle. But notice — these are professionals with risk management desks. They’re also using options on futures to cap their downside, not raw directional bets.
The Core Risks Beginners Consistently Underestimate
Contango and backwardation: These are the pricing structures of futures curves. In contango (common in oil markets), rolling over contracts monthly can silently eat your returns even if the underlying commodity price goes up. Many beginners don’t realize their ETF is losing value due to this “roll cost.”
Margin calls: If your position moves against you and your account balance drops below the maintenance margin, your broker will demand more cash — immediately. Failure to respond can mean automatic liquidation at the worst possible moment.
Geopolitical black swans: A single OPEC+ decision, a Middle East escalation, or a surprise U.S. export policy change can move crude oil 5–8% in a single session. Futures amplify that move dramatically.
Seasonality misreads: Natural gas and agricultural commodities have strong seasonal patterns, but these can be overridden by weather anomalies and policy shocks — making simple seasonality bets unreliable in 2026’s climate-disrupted world.
Realistic Alternatives: Smarter Entry Points for Beginners
Here’s where I want to be genuinely helpful rather than just educational. If you’re new to this space, here are tiered alternatives ranked from lowest to highest complexity:
Tier 1 — Commodity ETFs: Funds like GLD (gold), USO (oil), or DJP (diversified commodities index) give you exposure without margin calls or contract rollovers. Perfect starting point.
Tier 2 — Commodity producer stocks: Investing in companies like Barrick Gold, ExxonMobil, or Freeport-McMoRan (copper) gives indirect commodity exposure with the additional buffer of corporate earnings and dividends.
Tier 3 — Commodity-focused mutual funds or ETFs of ETFs: Managed exposure with professional oversight. Lower returns ceiling, but also lower floor.
Tier 4 — Micro futures contracts: CME now offers micro WTI crude oil and micro gold futures, where contract sizes are 1/10th of standard contracts. This is the most reasonable “real futures” entry point for beginners who want genuine market experience with capped downside.
Tier 5 — Standard futures contracts: Only consider this after you’ve paper-traded for at least 3–6 months and have a clearly defined risk management system.
Building Your Framework Before You Trade a Single Dollar
Before placing any trade, get honest answers to these questions:
Do I understand what drives this commodity’s price? (Supply chains, geopolitics, weather, currency effects?)
What is my maximum acceptable loss on this position — in dollars, not percentages?
Have I paper-traded this strategy for at least 30 days?
Do I understand the specific contract specs — expiration date, settlement type (physical vs. cash), and tick size?
What’s my exit plan if the trade moves 10% against me immediately?
If you can’t answer all five clearly, you’re not ready for direct futures trading — and that’s completely okay. Building toward readiness is itself a smart investment strategy.
The Bottom Line
Commodity futures investing in 2026 is genuinely exciting — the macro forces at play (energy transition, green metal demand, global food security concerns) create real opportunities. But the leverage mechanics mean that excitement cuts both ways. The smartest path for a beginner isn’t to avoid commodities entirely — it’s to build your exposure intelligently, starting with ETFs or producer stocks, learning the market’s language, and only graduating to futures when you’ve earned the right through knowledge and practice.
My friend with the oil contract? She’s now a patient GLD ETF holder. She’s up 11% this year and sleeping much better.
Editor’s Comment : The commodity markets in 2026 are genuinely one of the most intellectually rich places to invest — full of real-world supply chains, geopolitics, and physics (yes, storage capacity matters!). But they reward preparation ruthlessly and punish impatience just as hard. My honest advice? Start by reading one commodity’s market fundamentals deeply for 60 days before touching real money. Understand why gold prices move. Understand what OPEC actually is. The traders who survive long-term aren’t the bravest — they’re the most prepared.
직장 동료 한 분이 얼마 전 이런 말을 했어요. “금값이 사상 최고치를 계속 갱신한다는데, 나도 금 선물 한번 해봐야 하는 거 아닐까?” 막연한 기대감과 약간의 불안감이 뒤섞인 표정이었죠. 2026년 현재, 지정학적 리스크와 달러 약세 기조, 그리고 에너지 전환 정책이 맞물리면서 원자재 시장이 다시 한번 뜨거운 주목을 받고 있습니다. 그런데 ‘원자재 선물(Commodity Futures)’은 주식과는 결이 다른, 독자적인 메커니즘을 가진 금융 상품이에요. 오늘은 처음 발을 들이려는 분들이 꼭 알아야 할 핵심 개념부터 실전 전략까지, 함께 차근차근 살펴보려 합니다.
1. 원자재 선물, 도대체 어떤 구조인가요?
선물(Futures)은 ‘미래의 특정 시점에 특정 가격으로 사고팔겠다’는 계약입니다. 예를 들어 현재 WTI 원유 선물 1계약은 1,000배럴 단위로 거래되고, 증거금(마진)은 통상 계약 총액의 5~10% 수준만 납입하면 됩니다. 이것이 바로 레버리지 효과예요.
2026년 3월 기준으로 주요 원자재 시장의 흐름을 수치로 살펴보면 다음과 같습니다.
금(Gold): 트로이온스당 약 3,050달러 선 유지. 달러 인덱스 약세와 중앙은행 매입 지속으로 고점 레벨을 지지받는 중.
농산물(Soft Commodities): 밀·옥수수는 기후 이상으로 공급 불확실성 확대 중.
레버리지가 10배라고 가정하면, 원자재 가격이 10% 하락했을 때 원금 전체를 잃을 수 있습니다. 반대로 10% 상승하면 원금의 100% 수익이 나오는 구조예요. 이 양날의 검을 이해하지 않으면 계좌는 순식간에 증발할 수 있다는 점, 먼저 솔직하게 말씀드려야 할 것 같습니다.
2. 콘탱고와 백워데이션 — 선물만의 독특한 비용 구조
주식과 결정적으로 다른 점이 바로 ‘롤오버(Roll-over) 비용’입니다. 선물에는 만기가 있어서, 계속 보유하려면 만기가 지난 계약을 팔고 다음 달 계약을 사는 작업을 반복해야 해요.
콘탱고(Contango)는 원월물(먼 만기) 가격이 근월물보다 높은 상태입니다. 이 상황에서 롤오버를 반복하면 ‘비싸게 사고 싸게 파는’ 구조가 반복되어 장기 보유할수록 손실이 누적됩니다. 원유 ETF가 원유 가격 상승 대비 수익률이 낮은 이유가 바로 이 콘탱고 때문이에요.
반대로 백워데이션(Backwardation)은 근월물이 원월물보다 비싼 상태로, 공급 부족 국면에서 자주 나타납니다. 이때는 롤오버 과정에서 오히려 수익이 더해지는 효과가 생깁니다. 2026년 현재 금 시장은 상대적으로 안정된 콘탱고 상태를 유지하고 있으며, 천연가스는 계절에 따라 백워데이션과 콘탱고를 빠르게 오가는 모습이라고 봅니다.
3. 국내외 초보 투자자들의 실제 사례에서 배우기
2025~2026년 사이, 국내에서도 금 관련 상품 투자자가 크게 늘었습니다. 한국거래소(KRX) 금 현물 시장 거래 대금은 2024년 대비 약 40% 이상 증가했고, 금 선물 계좌 신규 개설도 눈에 띄게 늘었어요. 그런데 흥미로운 점은, 단순 현물 ETF로 접근한 투자자들의 수익률이 실제 선물 직접 투자자들보다 평균적으로 더 안정적이었다는 점입니다. 레버리지와 롤오버 비용을 충분히 이해하지 못한 상태에서 직접 선물에 뛰어든 초보 투자자들이 변동성 장세에서 손실을 본 사례가 적지 않았거든요.
해외에서는 미국의 CME(시카고상업거래소)가 소액으로 거래 가능한 마이크로 선물(Micro Futures) 상품을 꾸준히 확대하고 있어요. 마이크로 금 선물의 경우 기존 계약의 1/10 크기로, 증거금도 훨씬 낮아 초보자가 리스크를 줄이며 경험을 쌓기에 유리한 구조입니다. 국내 투자자들도 해외 선물 계좌를 통해 접근 가능하다는 점 참고해두세요.
4. 초보자를 위한 실전 접근 전략
원자재 선물에 처음 도전한다면, 아래 순서를 권해드리고 싶습니다.
1단계 — 모의 투자 먼저: 국내외 증권사 HTS/MTS 대부분이 해외 선물 모의 거래를 지원합니다. 최소 1~2개월은 실제 돈 없이 연습해보세요.
2단계 — 마이크로 계약으로 시작: CME 마이크로 골드(MGC), 마이크로 원유(MCL) 등 소단위 계약으로 실전 감각을 익히세요. 손실이 나도 학습 비용으로 감당할 수 있는 규모를 설정하는 것이 핵심입니다.
3단계 — ETF와 병행 이해: KODEX 골드선물(H), TIGER 원유선물Enhanced(H) 같은 국내 원자재 ETF를 활용하면 선물 구조를 간접적으로 체험하면서 콘탱고 비용을 실감할 수 있어요.
4단계 — 손절 원칙 사전 설정: 선물은 ‘버티기’가 통하지 않습니다. 증거금 유지율이 깨지면 강제 청산(반대매매)이 됩니다. 계약 진입 전에 반드시 손절 가격을 정해두세요.
5단계 — 매크로 공부와 병행: 원자재 가격은 달러 인덱스, 금리, 지정학적 이슈에 매우 민감합니다. 미 연준(Fed) 정책 방향과 중국의 원자재 수요 데이터를 주기적으로 확인하는 습관이 필요합니다.
5. 세금과 환율 — 놓치기 쉬운 현실적 비용
국내 해외 선물 거래 수익은 ‘기타소득’으로 분류되어 연간 250만 원 초과분에 대해 22% 세율(지방소득세 포함)이 적용됩니다. 또한 달러로 거래되는 해외 선물의 경우 환율 변동이 수익률에 추가 변수로 작용합니다. 원화 강세 국면에서 달러 표시 수익이 나도 환전 후 원화 수익이 줄어드는 경우가 있으니, 환헤지 여부도 전략에 포함시키는 게 좋을 것 같아요.
에디터 코멘트 : 원자재 선물은 분명히 매력적인 투자 수단입니다. 인플레이션 헤지, 포트폴리오 분산, 레버리지 수익 기회 모두 실재하니까요. 하지만 2026년 현재 시장 변동성이 큰 만큼, ‘빠른 수익’보다는 ‘구조를 이해하는 것’에 먼저 시간을 투자하는 편이 훨씬 현명한 접근이라고 봅니다. 주식으로 어느 정도 감각을 쌓은 분이라도, 선물은 처음부터 다시 배운다는 마음으로 임하시길 권해드립니다. 서두르지 않아도 시장은 항상 거기 있으니까요.
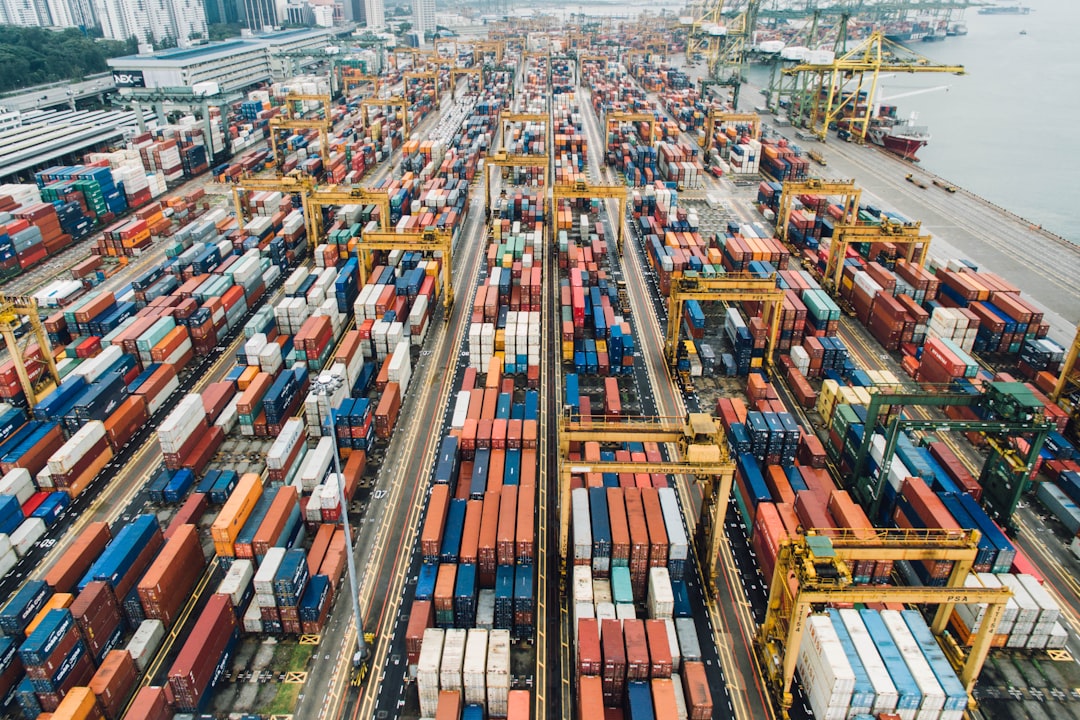
Picture a massive stone dropped into the center of a still lake. The ripples don’t just spread — they bounce off the shores, overlap, and reshape the entire surface of the water. That’s essentially what’s happening right now with China’s economic slowdown, and whether you’re a small business owner in Ohio, a tech entrepreneur in Berlin, or a commodity trader in Sydney, you’re feeling those ripples whether you realize it or not.
As of early 2026, China’s GDP growth has settled into a range that would have been considered a crisis just a decade ago. The world’s second-largest economy is no longer the unstoppable engine it once was — and that changes everything for global markets, supply chains, and investment strategies.
Where China Stands Right Now: The Numbers Behind the Narrative
Let’s ground ourselves in what’s actually happening. China’s GDP growth in 2025 clocked in at approximately 4.2%, a figure that sounds respectable on its face but represents a meaningful deceleration from the 8–10% growth rates that defined the 2000s and early 2010s. Forecasts for 2026 are hovering in the 3.8–4.5% range, depending on the source — and several international institutions are quietly revising those numbers downward.
What’s driving this? A few structural forces that aren’t going away anytime soon:
Property sector debt overhang: The collapse of major developers like Evergrande and Country Garden left a multi-trillion yuan wound in China’s financial system. Real estate, which once accounted for nearly 25–30% of GDP activity, is still struggling to find a stable floor.
Demographic headwinds: China’s working-age population has been shrinking since the early 2020s. Fewer workers means lower productivity potential — it’s straightforward math with long-term consequences.
Deflationary pressure: Consumer price inflation in China has been persistently low or even negative in some months, signaling weak domestic demand. When people aren’t spending, the engine stalls.
Technology decoupling: Ongoing restrictions on semiconductor exports from the U.S. and allied nations have constrained China’s ability to move up the value chain in key industries.
Youth unemployment crisis: Urban youth unemployment has remained stubbornly elevated, suppressing consumer confidence among the demographic that should be powering domestic consumption growth.
How This Plays Out Globally: The Sectors Most at Risk
Here’s where it gets really interesting — and frankly, concerning — for the rest of the world. China doesn’t just participate in the global economy; in many sectors, it is the demand story. When that demand softens, the consequences are wide-ranging.
Commodity exporters take the first hit. Australia, Brazil, and several African nations built significant portions of their export revenues around Chinese demand for iron ore, copper, and agricultural products. With Chinese construction activity sluggish and industrial output cooling, commodity prices have faced persistent downward pressure through 2025 and into 2026. Brazil’s soybean exports, for instance, have seen price compression even as volume held relatively steady — a margin squeeze that’s hitting Brazilian agribusiness hard.
Southeast Asian manufacturing hubs face a double-edged reality. On one hand, companies diversifying supply chains away from China have boosted investment in Vietnam, Indonesia, and Thailand. On the other hand, these countries still rely heavily on Chinese intermediate goods and Chinese tourists. A weaker China means less tourism revenue and more complex supply chain dynamics — not the clean win many expected from the “China+1” diversification strategy.
European luxury and automotive sectors are feeling genuine pain. China became the largest market for premium German automobiles and French luxury goods. As Chinese middle-class confidence wavers, brands like BMW, Mercedes-Benz, LVMH, and Kering have all cited China weakness as a material drag on 2025 earnings — and 2026 guidance is cautious at best.
The Supply Chain Realignment: Not as Simple as It Looks
There’s a tempting narrative that goes like this: China slows down → manufacturing moves elsewhere → problem solved for global businesses. If only it were that clean.
The reality is that China remains deeply embedded in global supply chains, not just as a manufacturer but as a processor of raw materials and a supplier of intermediate components. Even products “made in Vietnam” or “assembled in Mexico” often contain Chinese inputs. A meaningful slowdown in Chinese industrial activity disrupts these upstream flows in ways that take years to fully reroute.
Consider the solar panel industry, where China controls an estimated 80%+ of global manufacturing capacity. As countries accelerate green energy transitions in 2026, they simultaneously need Chinese panels and want to reduce dependence on them — a tension that’s playing out in trade policy, subsidy battles, and supply shortages in markets that rushed to diversify too quickly.
Financial Markets: The Contagion Risk That Keeps Analysts Up at Night
Beyond the real economy, there’s the question of financial contagion. China’s property sector debt crisis has largely been managed through a combination of government intervention, debt restructuring, and financial repression — but the underlying risks haven’t disappeared, they’ve been redistributed.
Local government financing vehicles (LGFVs) in China are carrying debt loads that many analysts consider unsustainable without central government support. If that support wavers, or if a disorderly default event occurs, the shock to Asian credit markets could be swift and severe, with spillover effects into emerging market bond funds that many retail investors hold without fully understanding the exposure.
Realistic Alternatives: How Businesses and Investors Can Adapt
Okay, so we’ve looked at the problem from multiple angles — now let’s think through what actually makes sense to do about it, whether you’re running a business or managing a personal investment portfolio.
For businesses with China exposure, the honest advice is to stop waiting for a dramatic Chinese economic rebound and start building for a structurally different reality. That means genuine supply chain diversification (not just a token factory in Vietnam), developing alternative customer relationships in India, the Middle East, and Southeast Asia, and stress-testing your revenue models against a scenario where Chinese demand stays at current levels for the next three to five years.
For investors, the China slowdown argues for a more nuanced emerging market strategy rather than a blanket “avoid EM” stance. India’s growth trajectory remains structurally compelling. Indonesia’s domestic consumption story is increasingly self-sufficient. Latin American commodity exporters with diversified customer bases offer different risk profiles than pure China plays.
For policymakers and governments, the China slowdown is actually an argument for accelerating domestic industrial policy — not in a protectionist panic, but in a strategic, long-term investment in capabilities that reduce single-point-of-failure dependencies. The countries that will navigate this most successfully are those that use this moment as a catalyst for genuine structural reform rather than defensive reaction.
And for everyday consumers? The China slowdown may actually mean more competitive pricing on certain categories — electronics, home goods, apparel — as Chinese manufacturers seek to maintain volume by competing harder on price in export markets. That’s a short-term silver lining worth noting, even as the broader picture remains complex.
The bottom line is this: China’s economic trajectory in 2026 isn’t a temporary blip that global markets can wait out. It represents a structural shift in the architecture of global growth — one that demands proactive adaptation, not passive observation. The ripples are here. The question is whether you’re positioned to navigate them or be knocked over by them.
Editor’s Comment : What strikes me most about this moment is how many businesses and investors are still operating on mental models built during China’s hypergrowth era — essentially waiting for the old China to come back. It won’t, at least not in the same form. The smartest move right now isn’t panic or paralysis; it’s honest reassessment. Ask yourself: does my current strategy assume a China that no longer exists? If the answer makes you uncomfortable, that discomfort is actually productive — it’s the first step toward building something more resilient for the years ahead.
얼마 전 지인이 운영하는 작은 수출 무역 회사 대표님과 커피를 마셨어요. 대화 중에 그분이 꺼낸 말이 인상적이었습니다. “중국 바이어들이 예전처럼 대량 주문을 넣지 않아요. 단가 협상도 더 팍팍해졌고요.” 사실 이 이야기는 그분만의 개인적인 불운이 아니라, 2026년 현재 전 세계 수많은 기업들이 공통으로 느끼는 현실이라고 봅니다. 중국 경제의 성장 속도가 눈에 띄게 꺾이면서, 그 여파가 단순히 중국 내부에 머물지 않고 우리 삶의 구석구석까지 파고들고 있거든요. 오늘은 이 흐름을 함께 짚어보려 합니다.
📊 숫자로 보는 중국 경제 둔화 현황
중국의 GDP 성장률은 팬데믹 이후 한때 강한 반등세를 보였지만, 2026년 현재 그 흐름은 상당히 다른 양상입니다. IMF 및 주요 글로벌 투자은행들의 최근 전망치를 종합하면, 중국의 2026년 실질 GDP 성장률은 약 4.3~4.6% 수준으로 집계되고 있어요. 과거 6~8%대를 당연하게 여기던 시절과 비교하면 사실상 ‘구조적 저성장’에 진입했다고 봐도 무방한 라인입니다.
특히 주목해야 할 지표들이 있어요.
부동산 시장 침체 지속: 헝다(恒大), 비구이위안(碧桂園) 사태 이후 중국 부동산 투자는 2026년에도 전년 대비 약 6~8% 감소세를 이어가고 있는 것으로 라고 봅니다. 부동산이 중국 GDP에서 차지하는 비중이 약 25~30%에 달한다는 점에서, 이 분야의 침체는 단순한 섹터 문제가 아니에요.
소비 심리 위축: 중국 소비자신뢰지수(CCI)는 역사적 평균을 여전히 하회하고 있으며, 청년 실업률은 공식 통계 기준으로도 15% 안팎을 맴돌고 있습니다.
디플레이션 압력: 중국 소비자물가지수(CPI)는 2026년 상반기 기준 0%대 초반으로, 디플레이션과 경계선에 서 있는 상황입니다. 수요 부진이 얼마나 심각한지를 보여주는 단적인 예라고 할 수 있어요.
수출 의존도 심화: 내수가 흔들리자 중국 기업들은 저가 수출 공세를 더욱 강화하고 있어요. 전기차(EV), 태양광 패널, 배터리 분야에서의 중국산 제품 가격 덤핑은 글로벌 공급망에 복잡한 파문을 일으키고 있습니다.
🌍 글로벌 파급효과 — 국내외 사례로 살펴보기
한국의 경우, 대중(對中) 수출 의존도가 전체 수출의 약 19~21%를 차지하는 만큼 중국 소비 둔화의 충격은 직접적입니다. 반도체, 석유화학, 철강 분야 기업들의 중국향 매출이 감소하면서, 이는 국내 제조업 생산지수와 기업 투자심리 지표에도 직접적인 하방 압력으로 작용하고 있어요. 실제로 2026년 국내 주요 경제연구소들은 대중 수출 감소가 한국 GDP를 0.3~0.5%p 가량 끌어내릴 수 있다는 분석을 내놓고 있는 상황입니다.
호주와 브라질은 또 다른 각도에서 타격을 받고 있어요. 중국의 인프라 투자 감소는 철광석, 구리, 리튬 등 원자재 수요 감소로 직결되고, 이 두 나라는 대(對)중국 자원 수출 비중이 높은 대표적인 국가들입니다. 브라질 헤알화와 호주 달러는 중국 경제 지표가 발표될 때마다 민감하게 반응하는 모습을 보이고 있어요.
유럽의 경우는 다소 복잡한 양상입니다. 독일 자동차 산업(폭스바겐, BMW, 메르세데스-벤츠)은 중국 시장 판매 부진으로 수익성이 악화되었고, 동시에 중국산 저가 전기차가 유럽 시장으로 대거 유입되면서 자국 산업 보호를 위한 반덤핑 관세 논쟁이 격화되고 있습니다. 중국 경제 둔화가 역설적으로 유럽 내 무역 갈등을 심화시키는 구조인 것이에요.
💡 우리는 이 흐름을 어떻게 읽고 대응해야 할까요?
중국 경제의 구조적 둔화는 단기 사이클의 문제가 아니라, 인구 감소, 중진국 함정(Middle Income Trap), 지정학적 공급망 재편이라는 장기 구조 변화와 맞물려 있는 것 같습니다. 따라서 단순히 “중국이 회복되면 괜찮아지겠지”라는 기대는 다소 낙관적일 수 있어요.
현실적인 대응 방향을 몇 가지 생각해 볼 수 있습니다.
수출 시장 다변화: 인도, 동남아시아(베트남, 인도네시아), 중동, 아프리카 등 중국을 대체하거나 보완할 수 있는 신흥 시장으로의 진출 전략이 더욱 절실해지고 있어요.
고부가가치 산업으로의 피벗: 중국이 저가 제조업과 기술 분야에서 빠르게 추격해오는 상황에서, 단순 가격 경쟁이 아닌 기술력·브랜드 차별화에 집중하는 것이 중장기적으로 유효한 전략이라고 봅니다.
공급망 리스크 관리: 중국산 중간재에 대한 의존도를 점검하고, 친디아(Chindia·중국+인도) 혹은 프렌드쇼어링(Friendshoring·동맹국 중심 공급망 재편) 전략을 적극 검토할 시점인 것 같아요.
개인 투자자 관점: 중국 관련 ETF나 원자재 펀드에 비중이 높다면, 포트폴리오 내 지역·섹터 분산을 다시 한번 점검해보는 것이 합리적일 것 같습니다.
에디터 코멘트 : 중국 경제 둔화를 그저 “저쪽 나라 이야기”로 두기에는, 우리 경제와의 연결고리가 너무나 촘촘합니다. 냉정하게 바라볼수록 오히려 기회가 보이기도 해요. 중국에 과도하게 쏠려 있던 의존도를 줄이고, 다음 성장 축을 어디에서 찾을 것인지 — 기업이든 개인이든 지금이야말로 그 답을 진지하게 고민해볼 때라고 생각합니다.
Picture this: It’s early 2026, and a mid-sized electronics manufacturer in South Korea is quietly renegotiating its supply contracts. Not because of internal issues — but because the ripple effects of China’s decelerating economy have started washing up on shores far beyond the South China Sea. If you’ve been following global economic headlines lately, you’ve probably noticed the growing buzz around China’s GDP growth rate slipping below the government’s own targets. But what does that actually mean in practice? Let’s think through this together, step by step.
The Numbers Behind the Slowdown
China’s official GDP growth target for 2026 was set at around 4.5–5%, but early quarterly data suggests the economy is struggling to consistently meet even the lower bound of that range. To put this in perspective, China was posting 8–10% growth rates just over a decade ago. The deceleration is structural, not merely cyclical, and that distinction matters enormously.
Key data points worth keeping in mind:
Property sector debt overhang: The lingering fallout from mega-developers like Evergrande and Country Garden continues to suppress domestic investment confidence, with real estate contributing roughly 25–30% of China’s GDP indirectly.
Youth unemployment: China’s urban youth unemployment rate hovered above 16% in early 2026, dampening consumer spending — the very engine Beijing has been trying to ignite.
Export contraction pressure: With the U.S. and EU doubling down on tariff structures and supply chain diversification (often called “friend-shoring”), China’s export machine faces structural headwinds rather than temporary friction.
Deflationary signals: Consumer Price Index (CPI) data from Q1 2026 showed persistent near-zero or slightly negative readings, suggesting weak domestic demand — a troubling sign for an economy trying to pivot to consumption-led growth.
Why This Slowdown Is Different From Past Cycles
Here’s where the analysis gets genuinely interesting. Past slowdowns in China — say, 2015–2016 — were largely demand-side shocks that Beijing could counteract with fiscal stimulus, infrastructure spending, or credit easing. The 2026 situation is more structurally complex. You’ve got three forces converging simultaneously:
1. Demographic drag: China’s working-age population is shrinking. The one-child policy era is now showing up as a labor force reality, meaning long-term productivity growth faces a natural ceiling.
2. Debt saturation: Local government financing vehicles (LGFVs) are carrying enormous debt loads, limiting the fiscal space for the kind of stimulus that worked in 2008–2009.
3. Geopolitical decoupling: Technology export controls from the U.S. — particularly around semiconductors — are slowing China’s ability to climb the value chain in high-growth sectors like AI hardware manufacturing.
Global and Domestic Ripple Effects: Real Examples
Let’s ground this in tangible cases, because abstract economic data can feel disconnected from real life.
South Korea: As one of China’s top trading partners, South Korea’s semiconductor and petrochemical exports have already felt the pinch. Samsung and SK Hynix both adjusted their China-facing revenue projections downward in early 2026. The Korean won has experienced heightened volatility partly as a reflection of this exposure.
Germany: German automakers — BMW, Volkswagen, Mercedes-Benz — which had been heavily reliant on Chinese consumers for premium vehicle sales, are now accelerating their pivot toward Southeast Asian and Indian markets. Volkswagen reportedly restructured its China joint venture strategy in Q1 2026.
Southeast Asia (beneficiary case): Interestingly, Vietnam, Indonesia, and Malaysia are quietly benefiting. As companies diversify manufacturing away from China, foreign direct investment (FDI) inflows into these countries have surged. Vietnam’s manufacturing export data for early 2026 shows double-digit growth in electronics and textiles.
Commodity markets: Australia, Brazil, and other commodity exporters are facing softer demand for iron ore and copper as Chinese construction activity remains subdued. Iron ore prices in early 2026 remain well below their 2021 peaks.
What Should Businesses and Investors Actually Do?
Rather than just observing the situation, let’s think through some realistic alternatives and adaptive strategies.
For small and mid-sized businesses with China exposure: Audit your supply chain dependencies honestly. Ask: “If my Chinese supplier faces a 20% revenue shock, what happens to my lead times and pricing?” Consider dual-sourcing arrangements, even if they’re initially more expensive — the resilience premium is often worth it.
For investors: Consider rebalancing portfolio exposure toward India, ASEAN markets, or even domestic industries that stand to benefit from supply chain reshoring. India’s manufacturing PMI has been consistently above 55 in early 2026, signaling strong expansion.
For individuals concerned about job markets: Skills tied to supply chain management, logistics optimization, and cross-border trade compliance are becoming increasingly valuable. The restructuring of global trade isn’t a crisis — it’s a transition, and transitions create new roles.
For policymakers and analysts: Watch China’s domestic stimulus announcements closely — specifically any moves toward consumer voucher programs or real estate floor pricing policies. These are leading indicators of whether Beijing is willing to accept a structural “new normal” or push for growth at all costs.
Is There an Upside Scenario?
Absolutely — and intellectual honesty demands we consider it. China still has formidable strengths: the world’s largest manufacturing base, a rapidly maturing EV and green energy sector (Chinese EV brands now hold significant market share across Southeast Asia, Latin America, and parts of Europe), and a government with the institutional capacity to deploy targeted support quickly.
If Beijing successfully executes its pivot toward high-value manufacturing — particularly in renewable energy tech, advanced robotics, and AI applications — we could see a productivity-led recovery that looks different from but is no less meaningful than the infrastructure-boom growth of previous decades. The slowdown narrative and the innovation-led recovery narrative aren’t mutually exclusive; both can be true simultaneously in different sectors.
The honest takeaway? China’s economic deceleration in 2026 is real, structural, and consequential — but it’s not a collapse. It’s a transition, and how you position yourself relative to that transition will likely matter more than whether the final GDP number is 4.3% or 4.8%. Stay curious, stay adaptable, and keep zooming out to see the full picture.
Editor’s Comment : It’s tempting to read “China slowdown” as a simple bad-news story, but the more I dig into the data, the more I see a genuinely complex reshuffling of global economic gravity — painful in some directions, opportunistic in others. The readers who’ll navigate 2026 best are those who resist binary thinking and ask: “Where does the disruption create an opening for me?” That’s the question worth sitting with.
얼마 전 지인이 이런 말을 하더라고요. “요즘 수출 거래처가 중국인데, 발주량이 눈에 띄게 줄었어. 뭔가 분위기가 심상찮아.” 중소 제조업체를 운영하는 분이었는데, 그 말이 꽤 오래 머릿속에 남았습니다. 단순히 거래처 한 곳의 문제가 아니라, 세계 2위 경제 대국인 중국의 ‘성장 엔진’이 예전 같지 않다는 신호가 곳곳에서 감지되고 있거든요.
2026년 현재, 중국의 경제 성장률 둔화는 더 이상 전문가들만의 화두가 아닙니다. 우리의 물가, 일자리, 투자 포트폴리오까지 서서히, 그러나 분명하게 영향을 미치고 있다고 봅니다. 함께 하나씩 짚어볼게요.
📊 숫자로 먼저 보는 중국 경제의 현재 위치
중국 국가통계국(NBS) 발표 기준으로, 2025년 중국의 실질 GDP 성장률은 약 4.6%로 집계됐습니다. 이는 2023년의 5.2%, 2024년의 4.9%에 이어 완만하지만 뚜렷한 하락 추세를 보여주는 수치예요. 중국 정부가 공식 목표로 내세웠던 ‘5% 안팎’에도 미치지 못한 결과입니다.
2026년 1분기 현재까지 확인되는 선행지표들도 낙관적이지만은 않아요. 주요 지표를 보면:
청년 실업률: 2025년 하반기 기준 약 17~18% 수준으로, 구조적 고용 불균형이 지속되고 있습니다.
부동산 시장: 헝다(恒大), 비구이위안(碧桂園) 사태 이후 부동산 투자가 GDP의 약 10% 이하로 떨어진 것으로 추정되며, 회복세가 더딘 상태입니다.
소비자물가지수(CPI): 디플레이션 압력이 이어지며 내수 소비 회복이 기대 이하에 머물고 있어요.
수출 의존도: 미국·EU와의 무역 갈등 심화로 대서방 수출이 위축되면서 ‘수출로 성장을 버티는’ 구조에도 균열이 생기고 있습니다.
외국인 직접투자(FDI): 2024년 FDI 유입은 30년 만의 최저 수준을 기록한 것으로 알려졌으며, 2026년 현재도 뚜렷한 반등 신호는 보이지 않는 상황입니다.
이 수치들이 단순히 ‘중국만의 문제’로 끝나지 않는다는 게 핵심입니다. 중국은 한국 전체 수출의 약 20% 내외를 차지하는 최대 교역국이니까요.
🌏 국내외에서 실제로 어떤 일이 벌어지고 있나
중국 경제 둔화의 파장은 이미 구체적인 사례들로 나타나고 있습니다.
▶ 한국 반도체·소재 산업의 타격 삼성전자, SK하이닉스 등 국내 반도체 기업의 대중 수출 비중은 여전히 높은 편이에요. 그런데 중국 내 스마트폰·PC 내수 소비가 살아나지 못하면서 메모리 반도체 수요가 기대치를 밑도는 상황이 반복되고 있습니다. 여기에 중국 자체 반도체 내재화(CXMT, YMTC 등)가 빠르게 진행되면서 장기적인 시장 잠식 우려도 커지고 있고요.
▶ 원자재 시장의 냉각 중국은 전 세계 철광석 수요의 약 70%, 구리 수요의 약 55%를 차지하는 ‘원자재 블랙홀’입니다. 중국 부동산 경기 침체가 이어지면서 철광석, 구리, 아연 등 산업 금속 가격은 2025년 내내 약세를 면치 못했어요. 이는 호주, 브라질 같은 자원 수출국 경제에도 직접적인 타격을 주고 있습니다.
▶ 글로벌 공급망 재편 가속화 애플, 삼성, 나이키 등 글로벌 기업들이 ‘차이나 플러스 원(China+1)’ 전략을 실행하며 베트남, 인도, 멕시코 등으로 생산 기지를 분산하는 속도가 빨라졌어요. 이는 중국 입장에서는 내수를 더욱 압박하는 악순환 요인이 되기도 합니다.
💡 그렇다면 우리는 어떻게 대응할 수 있을까
중국 경제의 구조적 둔화는 단기간에 해결될 문제가 아닐 가능성이 높다고 봅니다. ‘4~5%대 성장’이 새로운 뉴노멀로 자리 잡는 흐름이라면, 우리가 취할 수 있는 현실적인 행동도 달라져야 하지 않을까요.
투자 포트폴리오 분산: 중국 익스포저(노출도)가 높은 한국 수출주 비중을 조정하고, 인도·동남아 성장 수혜주나 미국 내수 소비재 등으로 분산을 고려해볼 만합니다.
수출 기업이라면 시장 다각화 검토: 인도, 중동(GCC), 동남아 시장은 아직 한국 기업의 침투율이 낮은 ‘블루오션’에 가깝습니다. 지금이 진입 타이밍을 탐색할 시기라고 봐요.
원자재 가격 변동성 활용: 산업용 금속 가격 약세 국면은 제조·건설 관련 기업에게 원가 절감 기회가 될 수 있습니다. 장기 공급 계약 검토가 유효할 수 있어요.
환율 리스크 관리: 위안화 약세 가능성이 열려 있는 만큼, 대중 수출 기업은 헤지(환위험 관리) 전략을 더 꼼꼼하게 점검할 필요가 있습니다.
물론 중국 경제가 ‘폭락’할 것이라는 시나리오는 과도한 비관론일 가능성이 높습니다. 중국 정부의 재정 여력과 정책 의지는 여전히 상당하거든요. 다만 ‘예전처럼 7~8% 고속 성장이 돌아온다’는 기대 역시 점점 현실과 멀어지고 있다는 점은 냉정하게 볼 필요가 있습니다.
에디터 코멘트 : 중국 경제 둔화를 단순히 ‘남의 나라 이야기’로 흘려듣기엔, 우리 일상과 너무 촘촘하게 연결되어 있다는 느낌을 지울 수가 없어요. 수출 의존도 높은 한국 경제 구조상, 이 흐름에 어떻게 적응하느냐가 앞으로 몇 년간 개인과 기업 모두에게 중요한 과제가 될 것 같습니다. 중국을 포기하자는 게 아니라, ‘중국 하나에 모든 걸 걸지 않는’ 유연한 전략이 지금 이 시점엔 가장 현실적인 답이라고 생각해요.
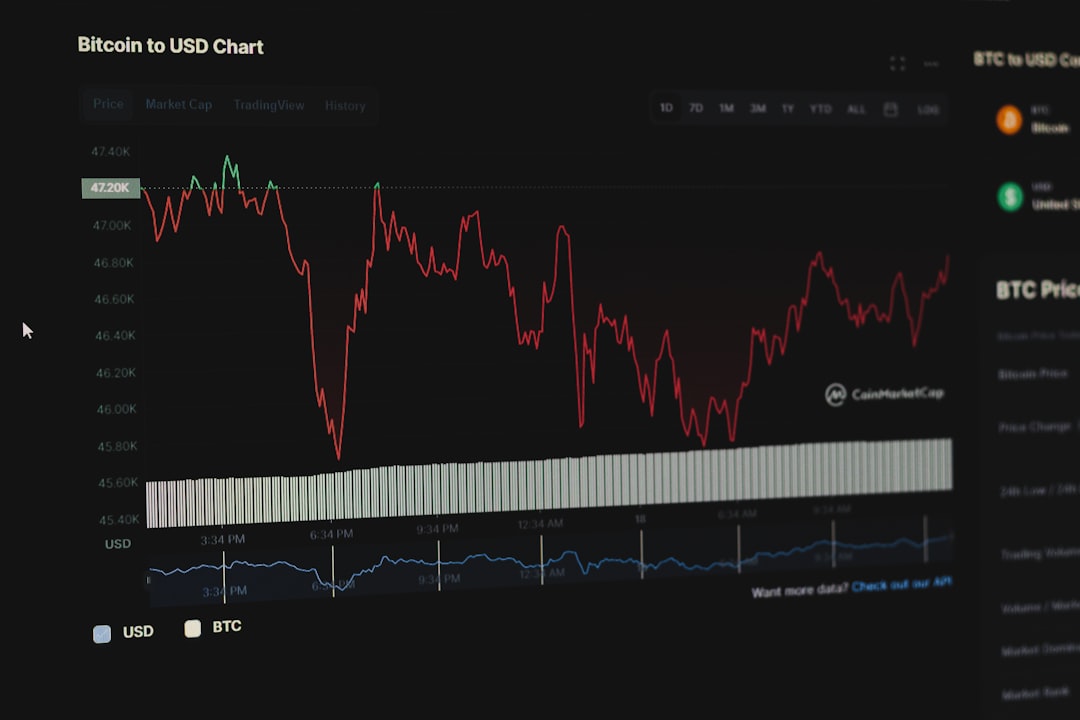
Let me paint you a quick picture. It’s early 2026, and you’re watching the news. Copper prices are surging thanks to the AI data center construction boom, gold is flirting with record highs, and oil markets are doing their usual unpredictable dance. A friend leans over and says, “I’ve got exposure to all of that — through one ETF.” You nod politely, but inside you’re thinking: what exactly is a commodity ETF, and how does someone like me actually get started?
That’s exactly the conversation we’re going to have today. No jargon walls, no condescending lectures — just a clear-eyed, honest exploration of how commodity ETFs work, why they might deserve a spot in your portfolio, and where to watch your step.
🔍 What Exactly Is a Commodity ETF?
A Commodity ETF (Exchange-Traded Fund) is a fund that trades on a stock exchange — just like a regular company share — but instead of tracking a business, it tracks the price of a physical commodity or a basket of commodities. Think gold, silver, crude oil, natural gas, wheat, copper, or even a broad mix of all of the above.
Here’s why this matters for beginners: traditionally, investing in commodities meant buying futures contracts, storing physical barrels of oil (yes, really), or accessing specialized trading platforms with high minimum capital requirements. Commodity ETFs removed all of that friction. You can now buy a single share of a gold ETF for roughly the cost of a nice dinner.
📊 Why Commodity ETFs Are Getting Attention in 2026
Let’s ground this in what’s actually happening this year. In 2026, several macro trends are pushing commodity ETFs into the spotlight:
AI Infrastructure Buildout: The massive expansion of data centers globally is driving unprecedented demand for copper, lithium, and rare earth materials. Copper prices crossed $5.20/lb in early 2026, a multi-year high.
Energy Transition Pressures: Renewable energy infrastructure still requires enormous quantities of steel, aluminum, and silver — creating sustained demand even as fossil fuel usage shifts.
Inflation Hedging: With core inflation proving stickier than central banks hoped, investors are revisiting commodities as a traditional inflation hedge. Historical data shows commodities often outperform stocks and bonds during inflationary periods.
Geopolitical Supply Disruptions: From Middle East tensions affecting oil routes to critical mineral export restrictions in Southeast Asia, supply shocks are becoming a recurring theme — and commodity ETFs let investors position for this without picking individual companies.
🗂️ The Main Types of Commodity ETFs You Should Know
Not all commodity ETFs are created equal. Here’s a breakdown that actually makes a difference to your returns:
Physical-backed ETFs: The fund literally holds the physical commodity in a vault (most common with gold and silver). Example: SPDR Gold Shares (GLD) or iShares Silver Trust (SLV). These closely track spot prices and are beginner-friendly.
Futures-based ETFs: Instead of holding the physical asset, the fund buys futures contracts. This is how most oil and natural gas ETFs work. Important caveat: these can suffer from “contango drag” — a situation where rolling over expiring futures contracts costs money, eroding returns even when the commodity price is rising.
Equity-based Commodity ETFs: These hold stocks of companies in commodity sectors — miners, oil producers, agricultural companies. Example: VanEck Gold Miners ETF (GDX). Returns are influenced by both commodity prices AND company performance.
Broad Commodity ETFs: Diversified baskets covering multiple commodities. Example: Invesco DB Commodity Index Tracking Fund (DBC). Good for beginners who don’t want to bet on a single commodity.
🌍 Real-World Examples: How It’s Done Globally and in Korea
Let’s look at how investors across different markets are actually approaching this in 2026.
In the U.S. Market: American retail investors have historically had the easiest access. Funds like GLD (Gold), USO (Oil), and PDBC (broad commodities) are available on any brokerage platform including Robinhood, Fidelity, and Schwab. The total AUM (assets under management) of commodity ETFs in the U.S. crossed $150 billion in early 2026, reflecting renewed institutional and retail interest.
In the Korean Market (국내 시장): Korean investors have increasingly gained access to commodity exposure through domestic ETFs listed on the KRX (Korea Exchange). Products like KODEX Gold Futures ETF and TIGER Crude Oil Futures ETF allow Korean retail investors to participate without opening a foreign brokerage account. However, it’s worth noting these are futures-based products, so understanding contango risk is especially important here.
In European Markets: ETCs (Exchange-Traded Commodities) are the more common structure in Europe, with providers like WisdomTree and iShares offering both physical and synthetic exposure across dozens of commodities on exchanges like the London Stock Exchange and Deutsche Börse.
⚙️ Step-by-Step: How to Actually Start Investing in Commodity ETFs
Here’s the honest, practical roadmap — no fluff:
Step 1 — Define Your Purpose: Are you hedging against inflation, speculating on a price move, or diversifying a stock-heavy portfolio? Your answer changes everything about which ETF to choose.
Step 2 — Choose Your Commodity Exposure: Single commodity (gold, oil) vs. broad basket. Beginners often do better starting with a broad commodity ETF or a simple physical gold ETF before diving into oil futures products.
Step 3 — Understand the Structure: Is it physical-backed or futures-based? Read the fund’s prospectus or product page — it will clearly state this. This is NOT optional reading.
Step 4 — Check the Expense Ratio: Commodity ETFs tend to have higher fees than plain equity index ETFs. Gold ETFs typically charge 0.25%–0.50% annually. Futures-based ETFs can run 0.75%–1.00% or higher. These fees compound over time.
Step 5 — Select a Brokerage: For international ETFs: TD Ameritrade, Charles Schwab, Interactive Brokers. For Korean investors: Kiwoom, Mirae Asset, Samsung Securities all offer access to both domestic and U.S.-listed commodity ETFs.
Step 6 — Start Small and Observe: Seriously. Start with a position small enough that a 20% drop won’t ruin your month emotionally. Commodities are volatile. This is not a set-it-and-forget-it asset class.
Step 7 — Rebalance Periodically: Most financial planners suggest commodity exposure of 5%–15% of a diversified portfolio. If a commodity rally pushes it past your target allocation, trim it back.
⚠️ The Risks That Don’t Get Talked About Enough
Let’s be real with each other here. Commodity ETFs carry some quirks that trip up beginners:
Contango & Backwardation: Futures-based ETFs can lose money even when the underlying commodity’s price stays flat or rises slightly, due to the cost of rolling contracts. Over a year, contango drag on oil ETFs has historically eroded 10–20% of returns in certain market conditions.
Currency Risk: If you’re investing in U.S.-listed ETFs from outside the U.S., exchange rate movements between your local currency and USD will affect your actual returns.
Tax Treatment: In many countries, commodity ETFs are taxed differently than equity ETFs. In the U.S., for example, gains from gold ETFs are taxed as collectibles (28% max rate) rather than the standard capital gains rate. Always check local tax rules.
Volatility: Crude oil dropped 30% in a matter of weeks during 2020 and swung wildly again in 2022. If you’re not mentally prepared for that kind of movement, a broad equity index fund might serve your goals better.
💡 Realistic Alternatives Worth Considering
Here’s where I’d push back a little on the “everyone should own commodity ETFs” narrative. They’re a tool, not a universal solution. Consider these alternatives depending on your situation:
If your main goal is inflation protection: TIPS (Treasury Inflation-Protected Securities) ETFs like SCHP or TIP offer more predictable inflation hedging with far less volatility than commodity ETFs.
If you want commodity exposure with less complexity: Equity-based commodity ETFs (like mining or energy sector ETFs) behave more like regular stocks and are easier to analyze, though they add company-specific risk.
If you’re a Korean-based investor with limited foreign account access: Domestic ETFs on KRX covering gold or energy are a perfectly reasonable starting point, even if the product range is narrower than U.S. markets.
If you just want gold as a safe-haven: A simple physical gold ETF (GLD, IAU, or the Korean equivalent) is genuinely one of the cleaner, more transparent financial products out there. No futures complexity, no contango drama.
The honest truth? For most beginners, a broad commodity ETF at 5–10% of your total portfolio is a reasonable way to dip your toes in, gain experience with the asset class, and hedge your equity exposure — without going all-in on a single commodity bet.
Editor’s Comment : Commodity ETFs are genuinely fascinating tools once you understand their mechanics — they democratized access to an asset class that used to belong exclusively to institutional traders and wealthy speculators. But they reward the curious and punish the careless. Before you place your first order, spend 30 minutes reading the specific fund’s fact sheet, understand whether it’s physical or futures-based, and be honest with yourself about your risk tolerance. In 2026, with so much happening in metals, energy, and agriculture markets, commodity ETFs are absolutely worth understanding — just make sure you’re investing with your eyes open, not just chasing the latest headline.
태그: [‘commodity ETF’, ‘ETF investing for beginners’, ‘gold ETF 2026’, ‘how to invest in commodities’, ‘commodity ETF guide’, ‘inflation hedge ETF’, ‘raw materials ETF investing’]
얼마 전 지인 한 명이 이런 말을 했어요. “주식은 너무 무섭고, 그렇다고 예금 이자만으론 불안한데… 뭔가 실물이 있는 데 투자하고 싶다”고요. 아마 비슷한 생각을 가진 분들이 꽤 많을 거라고 봅니다. 금값이 2026년 들어 온스당 3,100달러를 넘어서고, 구리·리튬 같은 산업용 금속 수요가 AI 인프라 확장과 맞물려 들썩이면서, 원자재(Commodity)에 대한 관심이 다시 뜨거워지고 있거든요. 그런데 막상 ‘원자재에 투자하겠다’고 결심해도, 금 현물을 직접 사기엔 보관이 번거롭고 원유 선물은 구조가 복잡하죠. 그 간극을 정확히 메워주는 게 바로 원자재 ETF입니다. 오늘은 이 ETF를 어떻게 이해하고, 어떤 방식으로 접근하면 좋을지 같이 살펴볼게요.
① 원자재 ETF란 정확히 무엇인가요?
ETF(Exchange-Traded Fund)는 증권거래소에 상장되어 주식처럼 사고팔 수 있는 펀드예요. 원자재 ETF는 그 투자 대상이 금, 은, 원유, 천연가스, 구리, 밀, 옥수수 등 실물 원자재이거나, 해당 원자재 관련 기업들로 구성된 인덱스를 추종합니다. 크게 세 가지 구조로 나눌 수 있어요.
실물 기반 ETF – 금·은 같은 귀금속을 실제로 보관하며 가격을 추종. 예: SPDR Gold Shares(GLD), iShares Silver Trust(SLV)
선물 기반 ETF – 원유·천연가스처럼 실물 보관이 어려운 원자재는 선물 계약을 굴려서 가격 흐름을 추종. 예: United States Oil Fund(USO)
원자재 기업 주식 ETF – 광산업체, 에너지 기업 등 원자재 관련 기업 주식을 묶은 것. 예: VanEck Gold Miners(GDX), Global X Lithium & Battery Tech(LIT)
초보 투자자라면 이 구분을 이해하는 게 굉장히 중요해요. 같은 ‘금 ETF’처럼 보여도 실물 보유냐 선물 굴리기냐에 따라 롤오버 비용(Roll Cost)이 발생하거나 수익 구조가 달라지거든요.
② 핵심 수치로 보는 원자재 ETF 현황 (2026년 기준)
숫자로 보면 좀 더 실감이 나라고 봅니다. 2026년 3월 현재 주요 원자재 ETF의 대략적인 운용 규모와 수익률 흐름은 다음과 같아요.
GLD (SPDR Gold Shares): 운용자산(AUM) 약 800억 달러 이상. 2025년 한 해 수익률 약 +28%. 2026년 들어서도 달러 약세·지정학 불안에 힘입어 강세 지속 중.
USO (United States Oil Fund): WTI 원유 선물 추종. 변동성이 크고, 선물 롤오버로 인한 ‘콘탱고(Contango)’ 손실 구조 때문에 장기 보유에 불리할 수 있음. 단기 트레이딩 성격이 강한 편.
PDBC (Invesco Optimum Yield Diversified Commodity Strategy): 에너지·금속·농산물을 분산해 담은 ETF로, 선물 롤오버 효율을 최적화한 구조. 최근 3년 연평균 수익률 약 +9~12% 구간.
국내 상장 원자재 ETF: KODEX 골드선물(H), TIGER 원유선물Enhanced(H) 등이 대표적. 원화로 투자 가능하지만 환헤지 여부에 따라 수익이 달라질 수 있음.
특히 총보수율(Expense Ratio)도 꼭 확인해야 해요. GLD는 연 0.40% 수준이지만, 일부 레버리지·인버스 원자재 ETF는 0.95% 이상인 경우도 있어서 장기 수익률에 은근히 영향을 미친다고 봅니다.
③ 국내외 실제 투자 사례로 보는 접근법
해외 사례부터 볼게요. 미국의 경우 연기금과 헤지펀드들이 포트폴리오의 5~15%를 원자재 ETF에 배분하는 전략을 오랫동안 써왔어요. 이른바 ‘인플레이션 헤지(Inflation Hedge)’ 목적인데, 주식·채권이 동시에 흔들리는 스태그플레이션 국면에서 원자재가 완충 역할을 한다는 논리예요. 실제로 2022년 글로벌 긴축 국면에서 S&P500이 -18%대를 기록할 때 원자재 인덱스인 Bloomberg Commodity Index는 +16% 수준의 성과를 냈던 사례가 있습니다.
국내 투자자 관점에서도 흥미로운 흐름이 있어요. 2025~2026년에 걸쳐 국내 증시의 변동성이 확대되면서, 개인 투자자들이 미국 주식 계좌를 통해 GLD·IAU 같은 금 ETF를 직접 매수하는 경향이 눈에 띄게 늘었습니다. 한국거래소(KRX) 데이터상으로도 국내 상장 금·원유 ETF의 거래량이 2026년 1분기 기준 전년 동기 대비 30% 이상 증가한 것으로 파악돼요. 단순한 투기 수요라기보다, 달러 분산과 실물 자산 편입이라는 전략적 수요가 커진 라고 봅니다.
④ 초보자가 특히 주의해야 할 3가지 함정
콘탱고(Contango) 효과: 선물 기반 ETF는 만기가 가까워진 선물을 팔고 더 비싼 원물을 사는 과정(롤오버)에서 비용이 발생해요. 원유 ETF를 장기간 들고 있었는데 원유 가격은 올랐는데 내 ETF는 제자리인 경우가 생기는 이유가 바로 이겁니다.
레버리지·인버스 ETF 착각: 2배 레버리지 원자재 ETF는 단기 트레이딩 도구예요. ‘지금 금값이 오르는 추세니까 2배짜리를 사서 장기 보유하면 이익이 두 배겠지?’라는 생각은 일일 복리 재설정(Daily Rebalancing) 구조 때문에 틀릴 가능성이 높아요.
환율 노출 여부 미확인: 국내 상장 ETF 중에도 환헤지(H 표시)를 하는 것과 환노출을 하는 것이 있어요. 원자재 가격이 올랐어도 달러 대비 원화가 강세면 원화 환산 수익이 줄어들 수 있거든요. 본인이 원하는 노출도(Currency Exposure)를 미리 생각해두는 게 좋습니다.
⑤ 초보자를 위한 현실적인 원자재 ETF 포트폴리오 구성 아이디어
처음 시작하는 분이라면 분산과 단순함을 우선시하라고 봅니다. 예를 들어 이런 구성을 생각해볼 수 있어요.
귀금속(금·은) 50%: IAU(iShares Gold Trust) 또는 국내 KODEX 골드선물(H) → 인플레이션·위기 헤지 역할
산업금속(구리·리튬) 30%: COPX(Global X Copper Miners ETF), LIT(Global X Lithium ETF) → 에너지 전환 테마와 연계
농산물·다각화 ETF 20%: DJP(iPath Bloomberg Commodity Index) 또는 PDBC → 식량 인플레이션 대비, 분산 효과
전체 투자 포트폴리오에서 원자재 ETF 비중은 10~20% 이내로 시작하는 게 무난하다고 봐요. 원자재는 그 자체로 배당이나 이자를 주는 자산이 아니라 가격 변동에서 수익이 나는 구조이기 때문에, 코어 포트폴리오(주식·채권)를 보완하는 위성 자산으로 다루는 게 장기적으로 합리적인 것 같습니다.
에디터 코멘트 : 원자재 ETF는 분명 매력적인 대안이에요. 실물에 기반한 가격 움직임, 인플레이션 헤지 기능, 주식 시장과의 낮은 상관관계까지. 그런데 ‘선물이냐 현물이냐’, ‘환헤지냐 환노출이냐’, ‘레버리지냐 일반형이냐’처럼 보이지 않는 구조적 차이가 수익률에 결정적인 영향을 미친다는 걸 꼭 기억해 주셨으면 해요. 처음엔 GLD나 IAU처럼 구조가 단순한 금 ETF 하나로 시작해보고, 감이 오면 조금씩 영역을 넓혀가는 게 가장 현실적인 방법이라고 봅니다. 투자는 결국 이해하는 만큼만 하는 게 가장 안전하니까요.
Picture this: it’s early morning, and you’re sipping your coffee while scrolling through financial news. The headline reads, “Fed Holds Rates Steady — Markets Rally.” You pause and think — wait, why does a decision made in a boardroom full of economists cause millions of investors to suddenly buy or sell stocks? If you’ve ever asked yourself that question, you’re already thinking like a serious investor. Let’s unpack this relationship together, because honestly, understanding central bank monetary policy might be the single most powerful edge you can develop in 2026’s volatile market landscape.
The Mechanics: How Monetary Policy Transmits to Stock Prices
At its core, monetary policy is a central bank’s toolkit for managing the economy — primarily through interest rates, asset purchases (quantitative easing), and forward guidance. The connection to stock markets isn’t magic; it’s math and psychology working together.
Here’s the logical chain most investors overlook:
Interest rates ↓ → Bond yields fall → Stocks become relatively more attractive (the classic “TINA” effect — There Is No Alternative)
Forward guidance → Shapes market expectations → Moves prices BEFORE the actual policy change
That last point is crucial. In modern markets, stocks don’t react to what happened — they react to what investors expect to happen. This is why a Fed meeting where rates are held unchanged can still cause a 2% market swing if the language in the statement shifts from “patient” to “vigilant.”
The Discount Rate Model: Why Math Validates the Relationship
If you want the theoretical backbone, look no further than the Discounted Cash Flow (DCF) model. A stock’s fair value is the present value of all future cash flows, discounted at a rate that includes the risk-free rate (typically tied to central bank policy rates). When the risk-free rate rises, the discount rate rises, and mathematically, the present value of future earnings falls — even if those earnings haven’t changed at all.
This explains why growth stocks (think high-multiple tech companies whose earnings are weighted far into the future) are dramatically more sensitive to rate hikes than value stocks with near-term cash flows. In 2022, when the Fed raised rates aggressively, the Nasdaq fell over 33% while the Dow dropped a comparatively modest 8.9%. That differential wasn’t random — it was the discount rate model playing out in real time.
2026 Global Context: Where We Stand Right Now
As of March 2026, the global central bank landscape is genuinely fascinating and a little unpredictable. The U.S. Federal Reserve has been navigating a delicate balance — inflation has cooled significantly from its 2022 peak, but services inflation and a resilient labor market have kept the Fed cautious about aggressive cuts. Meanwhile, the European Central Bank (ECB) moved slightly ahead of the Fed in its easing cycle, and the Bank of Japan (BoJ) — after decades of ultra-loose policy — is still in the early stages of normalization, creating ripple effects across global carry trades.
South Korea’s Bank of Korea (BoK) presents an interesting case study. The BoK has been threading the needle between supporting a slowing domestic economy and managing currency stability against a strong dollar environment. When the BoK cut rates in late 2025, the KOSPI responded with a short-term rally, but gains were quickly tempered by concerns about the won’s depreciation — illustrating that monetary policy effects on stocks are never one-dimensional.
The Correlation Isn’t Always Straightforward — Here’s Why
Here’s where things get intellectually interesting. The relationship between central bank policy and stock markets is real, but it’s not linear or perfectly predictable. Several factors complicate the picture:
The “Bad News is Good News” Paradox: Weak economic data sometimes rallies markets because it signals potential rate cuts. Investors cheer poor job numbers — which sounds absurd until you understand the monetary policy transmission mechanism.
Credibility and Trust: Markets respond differently to central banks with high credibility (like the Fed or BoJ) versus those perceived as politically influenced. A rate cut from a credible central bank can boost stocks; the same cut from a less credible institution might trigger currency panic and stock sell-offs.
The Lag Effect: Monetary policy typically takes 12–18 months to fully transmit through the economy. Stock markets, being forward-looking, often “price in” policy effects months before they materialize economically.
Sector Divergence: Not all sectors respond equally. Financials (banks) often benefit from higher rates through wider net interest margins. Utilities and REITs, which carry heavy debt loads, suffer. Tech and growth stocks are rate-sensitive. Understanding these nuances is essential for portfolio construction.
Global Capital Flows: In 2026’s interconnected markets, a Fed decision doesn’t just move U.S. stocks — it shifts capital flows across emerging markets, currencies, and commodity prices simultaneously.
Realistic Strategies for Investors Navigating This in 2026
So what do you actually do with this knowledge? Let me offer some grounded, realistic approaches rather than oversimplified rules:
1. Watch the yield curve, not just the headline rate. The spread between 2-year and 10-year Treasury yields is often a more nuanced signal than the fed funds rate alone. An inverted yield curve has preceded every U.S. recession in modern history, and its normalization (or re-inversion) in 2026 is worth monitoring closely.
2. Diversify across rate-sensitivity profiles. Rather than betting on the direction of rates, build a portfolio that performs reasonably across different rate environments. This might mean balancing growth stocks with dividend-paying value stocks and real assets like commodities or inflation-linked bonds.
3. Don’t fight the Fed — but don’t blindly follow it either. The old Wall Street adage “Don’t fight the Fed” holds wisdom, but remember that markets often overshoot. When everyone is positioned for rate cuts, the actual cuts can be a “sell the news” moment. Contrarian thinking has value.
4. Track central bank communication, not just decisions. In 2026, the most market-moving information often comes from Fed Chair speeches, FOMC minutes, and the “dot plot” (the Fed’s own projections for future rates) rather than from the actual rate decisions themselves.
5. Consider geographical diversification to exploit policy divergence. When major central banks are on different policy paths — as they often are in 2026 — there are opportunities in markets where policy tailwinds are strongest. This requires understanding currency risk but can be rewarding.
Editor’s Comment : The relationship between central bank policy and stock markets is one of those topics that rewards deeper thinking the more you explore it. What I find most compelling in 2026 is that we’re in a genuinely unusual historical moment — central banks globally are recalibrating after the most aggressive rate hiking cycle in decades, and the path forward is genuinely uncertain. The investors who will navigate this best aren’t those who claim to predict the Fed’s next move, but those who understand the mechanisms well enough to position themselves thoughtfully across multiple scenarios. Think of monetary policy literacy not as a crystal ball, but as a map — it won’t tell you exactly where you’re going, but it’ll help you avoid walking off a cliff.