지인 중 한 명이 2023년 말, 천연가스 선물에 전 재산의 30%를 몰아넣었다가 반 토막 난 경험을 털어놓은 적이 있어요. “뉴스에서 에너지 가격 오른다고 해서…”라고 말을 흐리던 그 표정이 아직도 기억에 남습니다. 원자재 시장은 주식이나 채권보다 훨씬 더 복잡한 변수들이 얽혀 있어요. 날씨, 지정학적 긴장, 달러 환율, 공급망 이슈까지. 그런데도 많은 투자자들이 ‘오를 것 같다’는 막연한 감으로 뛰어들다가 낭패를 보곤 합니다.
2026년 현재, 글로벌 원자재 시장은 여전히 요동치고 있습니다. 중동 지역의 지정학적 불안정성, 미국의 금리 정책 방향성, 그리고 AI 산업 확장으로 인한 구리·희토류 수요 급증까지 — 이 모든 요인이 복잡하게 맞물려 있죠. 그래서 오늘은 ‘어떻게 하면 원자재 투자에서 리스크를 줄이면서도 기회를 잡을 수 있을까’를 함께 고민해 보려 합니다.
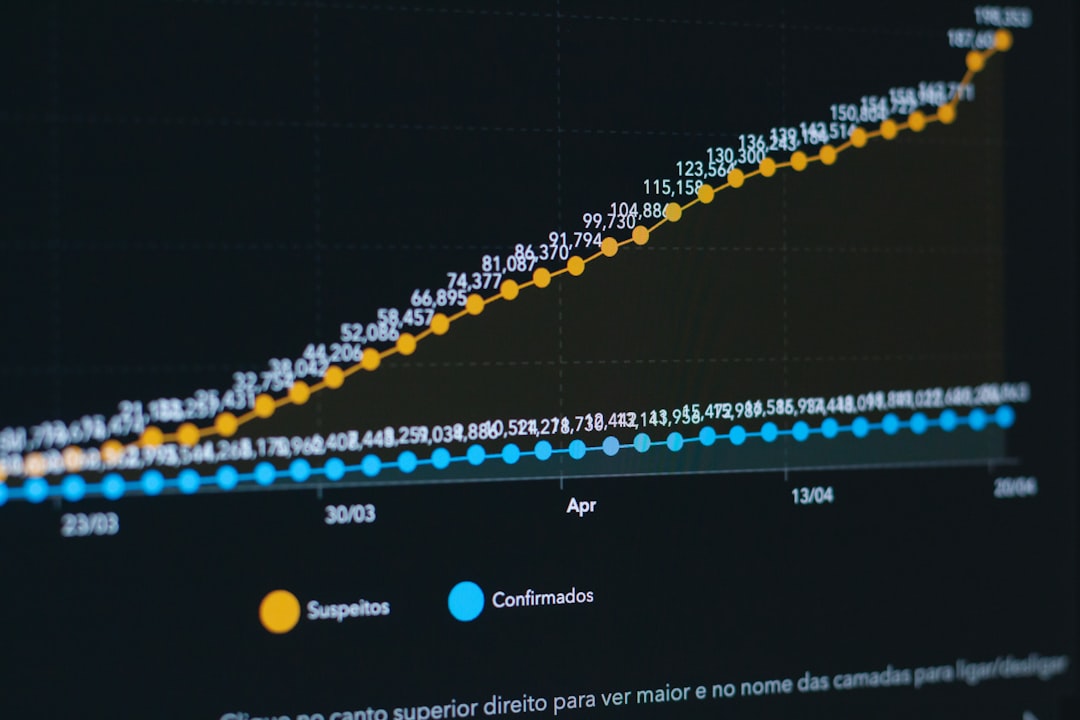
📊 본론 1. 숫자로 보는 원자재 시장의 변동성 — 얼마나 위험한가?
원자재 투자의 리스크를 체감하려면 먼저 ‘변동성 지표’를 들여다볼 필요가 있어요. 금융에서는 이를 표준편차(Standard Deviation)나 VIX 계열 지수로 표현하는데, 원자재 섹터는 일반 주식 지수보다 변동성이 평균 1.5~2배 높은 것으로 알려져 있습니다.
원유(WTI 기준): 연간 가격 변동폭이 평균 ±35~45% 수준으로, 2022년 러시아-우크라이나 전쟁 당시 단 3개월 만에 배럴당 70달러에서 130달러 이상으로 급등했다가 연말엔 다시 75달러대로 추락했어요.
천연가스: 계절성과 기후 변수가 워낙 커서 단기 변동폭이 원유보다 더 심한 경우도 많아요. 2022년 유럽 에너지 위기 당시 TTF 가스 가격은 6개월 만에 900% 폭등하기도 했죠.
구리: 2026년 현재 AI 데이터센터 및 전기차 배터리 인프라 수요로 장기 강세 전망이 우세하지만, 중국 경기 둔화 신호가 나올 때마다 단기 조정폭이 10~20%에 달합니다.
금(Gold): 상대적으로 안전자산으로 분류되지만, 실질금리 상승기에는 무이자 자산인 금의 매력이 감소해 -15% 이상 조정받은 사례도 있어요.
이처럼 원자재마다 리스크의 성격이 달라요. 에너지는 지정학·기후 리스크, 금속은 수요·경기 리스크, 농산물은 기상·정책 리스크가 주된 드라이버라고 볼 수 있습니다. 이걸 구분하지 않고 ‘원자재 = 인플레이션 헤지’라는 단순한 공식만 믿고 투자하면 위험할 수 있어요.
🌍 본론 2. 국내외 사례로 배우는 리스크 관리 전략
① 노르웨이 국부펀드(GPFG)의 분산 접근법
세계 최대 국부펀드 중 하나인 노르웨이 정부연금펀드는 원자재 직접 투자보다 원자재 관련 주식(채굴·정제 기업)에 분산 투자하는 방식을 택합니다. 원자재 실물이나 선물에 직접 노출되는 것보다 기업의 헤징 능력과 경영 리스크 관리 역량을 신뢰하는 전략이죠. 이는 ‘간접 투자로 변동성 완충’이라는 교훈을 줍니다.
② 국내 사례 — 2022~2023년 요소수 대란과 공급망 리스크
2021년 말 중국의 요소 수출 제한으로 국내 물류가 마비될 뻔했던 사건을 기억하시나요? 이는 특정 원자재에 대한 단일 공급처 의존도가 얼마나 위험한지를 잘 보여주는 사례입니다. 이후 한국 정부와 기업들은 전략 비축량 확대와 공급처 다변화 전략을 본격화했어요. 개인 투자자 입장에서도 마찬가지 — 특정 원자재 하나에 집중하는 건 ‘단일 공급처 의존’과 다를 바 없습니다.
③ 2026년 구리 붐과 ETF 활용 전략
2026년 현재 AI 인프라 투자 확대와 에너지 전환 정책으로 구리 수요가 구조적으로 늘고 있어요. 하지만 단순히 구리 선물을 매수하면 롤오버 비용(Roll-over Cost) 문제가 발생합니다. 선물 계약 만기가 도래할 때마다 다음 달 계약으로 갈아타는 과정에서 손실이 누적될 수 있거든요. 이 때문에 전문 투자자들은 구리 현물 ETF나 구리 채굴 기업 주식 ETF를 선호하는 경향이 있습니다.
🛡️ 본론 3. 실전 리스크 관리 방법 — 5가지 핵심 원칙
포지션 사이징(Position Sizing): 단일 원자재에 전체 포트폴리오의 5~10% 이상 배분하지 않는 것이 일반적인 원칙이에요. 아무리 확신이 있어도 ‘최대 손실 허용 범위’를 먼저 정해두는 게 중요합니다.
상관관계 분산: 금, 원유, 구리, 농산물은 서로 다른 가격 드라이버를 갖고 있어요. 이들을 적절히 섞으면 하나가 급락해도 포트폴리오 전체의 충격을 줄일 수 있습니다. 이른바 낮은 상관계수(Correlation) 자산 혼합 전략이라고 볼 수 있어요.
달러 환율 헤징 고려: 원자재는 대부분 달러로 거래되기 때문에, 원화 강세 시기에는 달러 표시 수익이 환차손으로 깎일 수 있어요. 환 노출을 의식적으로 관리하는 것도 리스크 관리의 일부입니다.
선물보다 ETF·ETN 활용: 앞서 언급한 롤오버 비용 문제와 레버리지 리스크를 피하려면, 직접 선물보다는 원자재 ETF나 관련 기업 ETF가 더 안전한 진입 방법이라고 봅니다. 특히 초보 투자자라면 더더욱이요.
매크로 지표 모니터링: 미국 ISM 제조업 지수, 중국 PMI, 달러인덱스(DXY)는 원자재 가격의 선행 지표로 활용됩니다. 이 지표들이 방향을 바꿀 때 포지션을 재점검하는 습관을 들이면 큰 리스크를 미리 피할 수 있어요.
💡 결론 — 완벽한 예측보다 ‘살아남는 전략’이 먼저
원자재 시장에서 완벽한 타이밍을 잡는 건 전문가도 쉽지 않아요. 오히려 많은 연구들이 ‘언제 살지’보다 ‘얼마나 살지, 손실이 나면 어디서 나올지’를 미리 정해두는 것이 장기 수익률에 훨씬 더 큰 영향을 미친다고 이야기합니다. 2026년처럼 지정학적 불확실성과 에너지 전환이 동시에 진행되는 복잡한 시기일수록, ‘리스크를 없애겠다’는 욕심보다 ‘리스크를 이해하고 관리하겠다’는 자세가 훨씬 현실적인 접근이라고 봐요.
분산투자, 포지션 사이징, ETF 활용, 환율 체크 — 이 네 가지만 꾸준히 실천해도 원자재 투자에서 ‘치명타’를 맞을 확률은 상당히 줄어들 거라고 생각합니다.
에디터 코멘트 : 개인적으로 원자재 투자를 처음 시작하는 분들께는 금 ETF 하나로 시작해 보길 권해드려요. 금은 상대적으로 정보가 투명하고 달러·금리와의 관계가 비교적 잘 연구되어 있어, 원자재 시장의 ‘논리’를 익히기 가장 좋은 교과서 같은 자산이거든요. 거기서 감을 잡은 뒤 구리나 에너지로 확장해 나가는 게 훨씬 안전한 여정이 될 것 같습니다. 📌
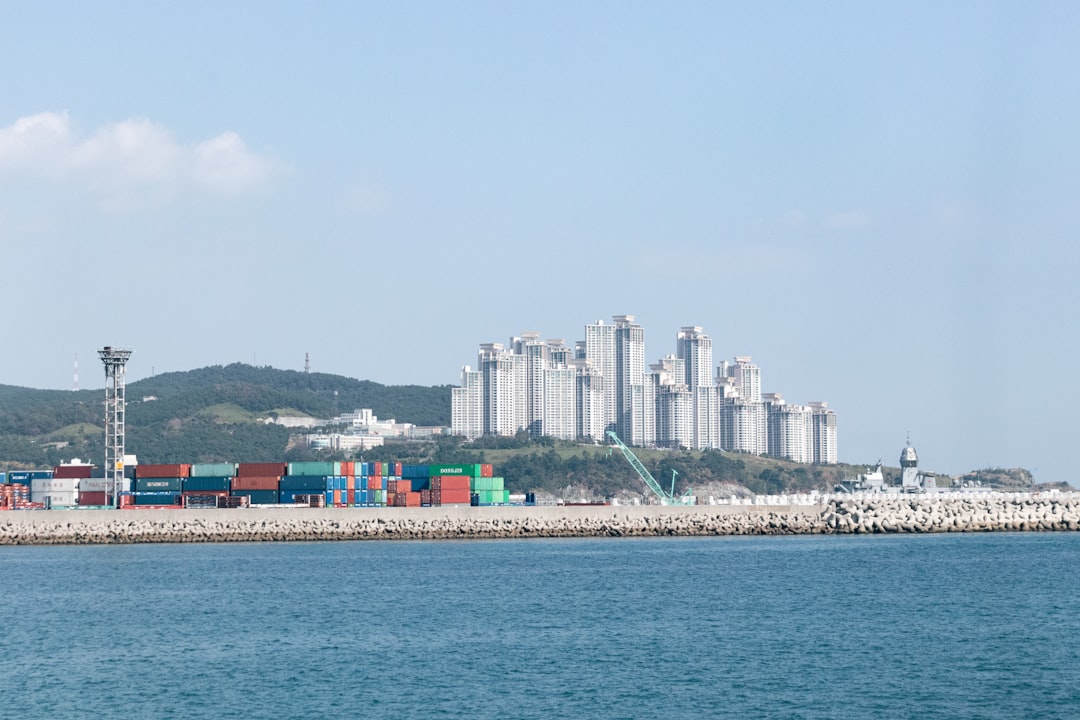
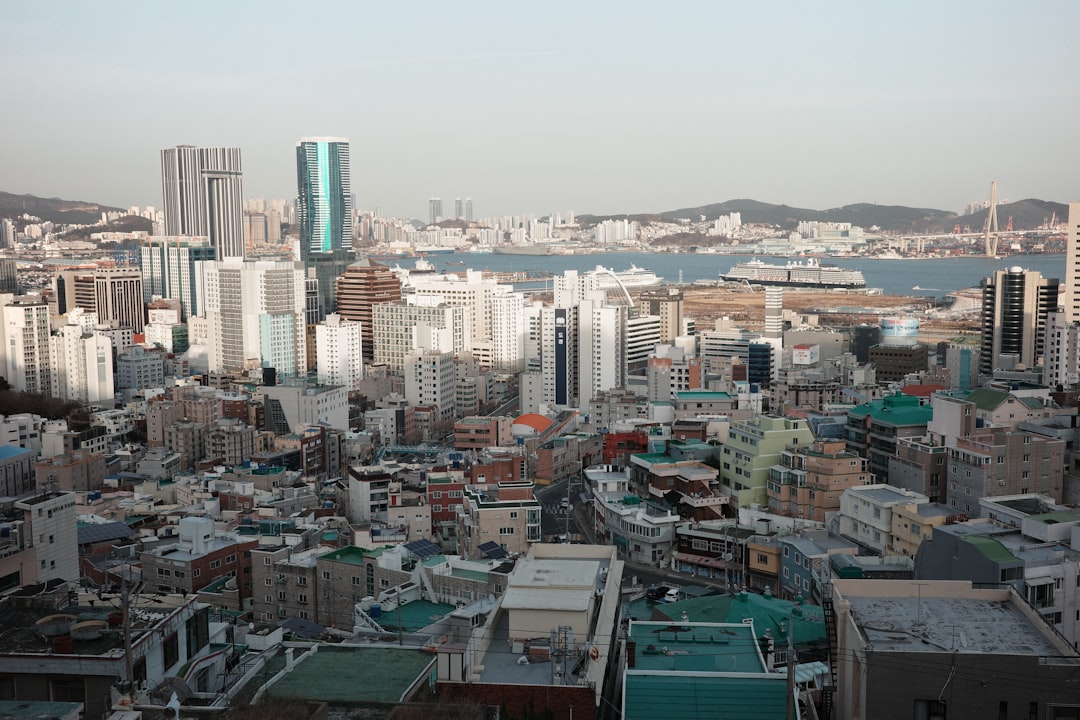
Picture this: it’s early 2026, and a mid-sized Korean electronics component manufacturer in Gumi is watching its order books with a mix of cautious optimism and quiet anxiety. Shipments to North American clients ticked up in Q1, but European demand remains sluggish, and the won’s persistent volatility is eating into already-thin margins. Sound familiar? This isn’t just one company’s story — it’s a pretty accurate snapshot of where Korea’s broader export economy stands right now.
Let’s think through this together, because the macro picture for Korea in 2026 is genuinely layered, and understanding it means looking at several moving parts simultaneously.
Where Korea’s Export Engine Stands in 2026
Korea’s export-driven economy has long been one of the most elegant — and fragile — machines in global trade. In 2026, that machine is running, but it’s running unevenly. According to Korea Customs Service data from early 2026, semiconductor exports — which still account for roughly 20% of total goods exports — have rebounded meaningfully after the cyclical downturn of the prior two years. DRAM and NAND flash demand, fueled by AI infrastructure buildouts globally, has given Samsung Electronics and SK Hynix a welcome tailwind.
But here’s the nuance: semiconductor strength is masking weaknesses elsewhere. Petrochemical exports remain under pressure from Chinese overcapacity, steel shipments face headwinds from global green trade tariff frameworks, and the auto sector — while still solid — is navigating a complex EV transition that’s reshaping supply chain relationships with traditional partners.
Semiconductors: Recovery driven by AI server demand; HBM (High Bandwidth Memory) chips are a particular bright spot for Korean chipmakers in 2026.
Automobiles: Hyundai and Kia maintain strong global market share, but EV platform investment pressure is weighing on near-term margins.
Petrochemicals: Structural oversupply from China continues to compress export prices, particularly in Southeast Asian markets.
Steel & Shipbuilding: Shipbuilding is actually a relative winner — LNG carrier and container ship orders remain robust, providing multi-year revenue visibility.
Display panels: Ongoing pressure from Chinese competitors, though OLED technology maintains a Korean premium edge.
The Macro Environment: Three Forces Shaping the Outlook
When we zoom out to the macroeconomic frame, three forces are doing most of the heavy lifting — or pushing back — on Korea’s export trajectory in 2026.
1. The U.S. Demand Pulse. The United States remains Korea’s second-largest export destination after China, and U.S. consumer and capital spending trends matter enormously. In 2026, the U.S. economy has cooled from its post-pandemic frenzy but avoided a hard recession, settling into what economists are calling a “soft plateau” — low but positive growth. For Korea, this means stable but not spectacular demand from American buyers, particularly for tech goods and EVs.
2. The China Complexity. China is simultaneously Korea’s largest trading partner and its most formidable competitor. In 2026, bilateral trade with China remains under structural pressure as Chinese domestic industries continue to move up the value chain, competing directly with Korean intermediary goods. The dependency that once seemed advantageous now demands strategic recalibration. Korea’s trade surplus with China — which was a defining feature of its economic model for decades — has effectively evaporated.
3. The Won’s Volatility Factor. The Korean won has been one of the more volatile major Asian currencies in the current cycle. A weaker won helps exporters on paper (making goods cheaper for foreign buyers), but it inflates import costs — particularly for energy — and creates serious hedging challenges for businesses without sophisticated treasury operations. The Bank of Korea’s policy rate decisions in 2026 are being watched closely precisely because of this tension between supporting growth and managing currency stability.
Domestic and International Case Studies Worth Watching
Let’s ground this in some real examples, because data only tells part of the story.
Domestically, POSCO’s pivot toward “green steel” — using hydrogen-based direct reduction processes — is a fascinating case study in how Korean heavy industry is trying to future-proof against European carbon border adjustment mechanisms (CBAM). The upfront investment is enormous, but the strategic logic is sound: if you’re going to export to markets that price carbon seriously, you need to decarbonize or accept permanent margin compression. POSCO’s 2026 capex allocation reflects exactly this kind of long-duration bet.
On the SME side, Korean beauty and consumer goods exporters (the K-beauty segment) continue to outperform, diversifying Korea’s export basket in a meaningful — if still small — way. Markets in Southeast Asia, the Middle East, and even Latin America are showing strong demand for Korean cosmetic and personal care brands, offering a counter-narrative to the heavy-industry export story.
Internationally, look at how Taiwan’s semiconductor industry is navigating similar challenges — heavy U.S. investment pressure (TSMC’s Arizona expansion), geopolitical risk exposure, and domestic talent pipeline concerns. Korea’s semiconductor giants face a structurally analogous situation with their U.S. fab investments (Samsung’s Texas facility, SK Hynix’s U.S. packaging partnership), and the policy learnings from Taiwan’s experience are directly applicable.
Realistic Alternatives and Strategies Worth Considering
So what does this all mean if you’re thinking about this from a practical standpoint — whether as an investor, a business operator, or just someone trying to understand where Korea’s economy is heading?
First, don’t over-index on any single sector narrative. The semiconductor rebound is real, but treating it as a one-size-fits-all signal for Korean economic health is a mistake. The divergence between sector performance is actually unusually wide in 2026, and that divergence matters.
Second, the geographic diversification story is more important than ever. Korean exporters who have been building relationships in India, Vietnam, and the broader ASEAN region — rather than remaining over-reliant on China — are finding that diversification paying off in 2026. This isn’t a new insight, but the execution gap between companies that embraced it early and those that didn’t is now clearly visible in earnings data.
Third, for those monitoring Korea from a macro investment lens, the current account balance and export volume data (rather than just value) deserve close attention. Currency effects can distort the value figures significantly; watching actual shipment volumes gives you a cleaner read on real demand conditions.
Finally, the structural question for Korea’s export economy in 2026 and beyond is really about value-chain positioning. The middle-ground of being a high-quality intermediate goods supplier is under pressure from both sides — commodity producers moving up and technology leaders moving down. Korea’s best companies are responding by doubling down on technological differentiation. That’s the right instinct, even if the timeline is longer than markets sometimes want.
Korea’s export story in 2026 isn’t a simple boom or bust — it’s a genuine inflection point, and how the country navigates the next few years will define its economic character for a generation.
Editor’s Comment : What strikes me most about Korea’s macro moment in 2026 is that the challenges are actually clarifying. The era of coasting on China demand and semiconductor cycles is definitively over, and that’s forcing the kind of strategic reckoning that Korea’s industrial policy has needed for years. Painful? Absolutely. But the companies and policymakers who lean into this transition rather than resist it are the ones worth watching closely.
올해 초, 서울 을지로의 한 중견 수출 기업 대표님과 나눈 대화가 머릿속에 오래 남았어요. ‘작년엔 그래도 반도체가 버텨줬는데, 올해는 도무지 감이 안 온다’는 말이었죠. 환율 변동성, 미국의 통상 압박, 중국 경기 둔화… 체감 경기와 지표 사이의 간극이 커질수록 불안은 깊어지는 것 같더라고요. 2026년 한국 경제의 수출 경기와 거시경제 흐름, 함께 짚어보겠습니다.
📊 숫자로 읽는 2026년 한국 수출 현황
한국무역협회(KITA)와 산업통상자원부 집계 기준으로, 2026년 1~2월 누적 수출액은 약 1,042억 달러 수준으로 전년 동기 대비 +3.8% 소폭 증가세를 기록했습니다. 수치만 보면 나쁘지 않아 보이지만, 내용을 들여다보면 이야기가 달라져요.
반도체: 여전히 전체 수출의 약 22%를 차지하는 핵심 품목이지만, HBM(고대역폭메모리) 중심의 AI 수요 쏠림이 심화되면서 일반 메모리 부문은 가격 압박을 받고 있어요.
자동차 및 배터리: 미국 IRA(인플레이션 감축법) 보조금 정책의 불확실성이 여전히 걸림돌이에요. 현대·기아차는 현지 생산 비중을 높이는 방향으로 전략을 선회하고 있는 상황입니다.
석유화학·철강: 중국의 공급 과잉과 내수 부진이 맞물리며 단가 하락 압력이 지속되고 있어요. 특히 대중 수출 비중이 높은 품목군의 타격이 라인 것 같습니다.
바이오·방산: 신성장 수출 동력으로 부상 중이에요. 방산의 경우 폴란드·중동 등으로의 수출이 뚜렷한 성과를 내며 외형 확대 중입니다.
원/달러 환율은 2026년 1분기 기준 평균 1,370~1,410원 내외에서 등락을 반복하고 있어요. 환율 상승이 수출 가격 경쟁력에 일부 도움을 주는 건 사실이지만, 수입 원자재 비용 증가라는 역효과도 동시에 발생한다는 점, 간과하면 안 됩니다.
🌐 글로벌 거시환경 — 한국에 유리한가, 불리한가?
2026년 글로벌 거시경제 지형에서 가장 주목해야 할 변수는 세 가지라고 봅니다.
① 미국 경제의 연착륙 여부 미 연방준비제도(Fed)는 2025년 하반기부터 금리 인하 사이클에 진입했지만, 속도가 시장 기대보다 느립니다. 고금리 장기화 여파로 미국 소비 심리가 완전히 회복되지 않은 상태이고, 이는 한국의 대미 수출 수요에 간접적인 영향을 주고 있어요.
② 미·중 기술 패권 경쟁의 구조화 반도체 장비 수출 규제, 첨단 기술 공급망 재편은 일시적 이벤트가 아니라 구조적 전환이 된 것 같습니다. 한국은 양측 모두와 긴밀한 경제 관계를 유지해야 하는 ‘샌드위치 딜레마’에 여전히 놓여 있어요.
③ 중국의 디플레이션 압력 중국 내수 부진과 부동산 위기 여파가 장기화되면서 중간재 수출 비중이 높은 한국 기업들의 체감 경기는 지표보다 더 차갑습니다. IMF는 2026년 중국 성장률을 4.5% 내외로 전망하고 있는데, 잠재 성장률과의 격차가 여전히 크다는 게 문제예요.
🏠 국내 거시경제 — 수출 호조가 내수로 이어지지 않는 이유
흥미로운 점은, 수출 지표가 플러스를 기록하고 있음에도 내수 체감 경기는 여전히 위축돼 있다는 거예요. 이른바 ‘수출-내수 디커플링(decoupling)’ 현상이라 부르는데요.
한국은행은 2026년 GDP 성장률을 1.8~2.1% 수준으로 예측하고 있어요. 숫자만 보면 크게 나쁘지 않지만, 성장의 질이 문제입니다. 수출 대기업의 이익이 협력사와 중소기업, 그리고 가계 소득으로 충분히 흘러내려오지 않는 구조가 고착화되고 있거든요. 고물가 기저 속에 가계부채 부담이 지속되면서 민간 소비는 좀처럼 회복 탄력을 찾지 못하는 모습이라고 봅니다.
💡 현실적으로 어떻게 대응할 것인가?
거시경제 전망을 읽는 것도 중요하지만, 결국 우리 각자가 이 흐름 안에서 어떤 판단을 내리느냐가 더 중요하겠죠. 몇 가지 관점을 나눠보면:
투자자 관점: 환율 변동성이 큰 시기인 만큼, 달러 자산 분산과 함께 수출 대형주보다는 내수 회복 수혜 업종(여행·외식·헬스케어)의 선별적 접근이 유효할 수 있어요.
소기업·자영업자 관점: 원자재 수입 비용 상승에 대비한 재고 관리와 결제 통화 다변화를 고민할 시점인 것 같아요.
직장인 개인 관점: 소속 산업이 수출 경기에 얼마나 연동되어 있는지 파악하고, 경기 사이클에 따른 커리어 리스크 관리를 병행하는 게 좋을 라고 봅니다.
정책 수요자 관점: 정부의 수출 금융 지원(무역보험공사, 수출입은행 프로그램)이나 스마트 제조 혁신 지원 사업을 적극적으로 탐색해볼 만해요.
결국 2026년 한국 수출 경기는 ‘나쁘지 않지만 고르지 않다’는 말로 요약할 수 있을 것 같아요. 반도체·방산 등 일부 품목의 호조가 전체 수출을 지탱하고 있지만, 그 온기가 경제 전반으로 퍼지기까지는 시간이 더 필요해 보입니다.
에디터 코멘트 : 거시경제 전망은 ‘맞추는 것’보다 ‘방향성을 읽고 시나리오를 준비하는 것’이 본질이라고 생각해요. 2026년 한국 경제는 분명히 역풍과 순풍이 동시에 불고 있는 복잡한 국면입니다. 수출 지표의 표면 수치에 안도하기보다는, 어떤 품목이 끌고 어떤 품목이 끌려가는지를 세분화해서 보는 습관이 중요한 시기인 것 같아요. 불확실성이 클수록, 정보의 질이 곧 판단의 질이 된다는 점을 기억하면 좋겠습니다.
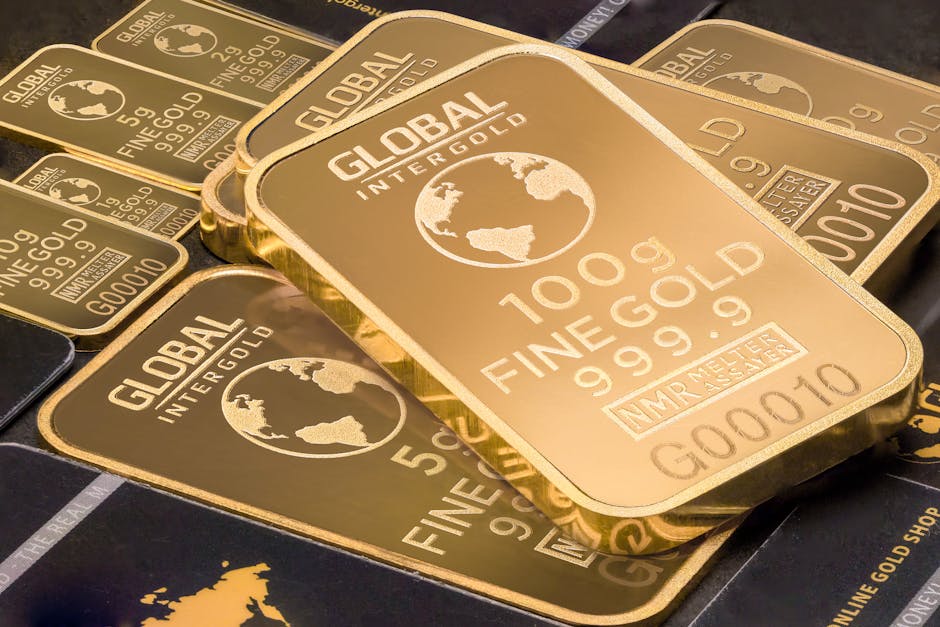
A friend of mine — let’s call her Mina — walked into a gold shop in Seoul’s Jongno district back in early 2025 with a modest budget and a nervous smile. She’d been hearing about gold hitting record highs and didn’t want to miss the train. Fast forward to March 2026, and she’s sitting on a position that’s up over 18%. But here’s the thing: she almost didn’t invest at all because she thought precious metals were “too complicated” or “only for the rich.” Sound familiar? Let’s unpack what’s really happening in the gold, silver, and precious metals space in 2026 — and think through this together.
📊 Where Are Gold & Silver Prices Right Now in 2026?
As of Q1 2026, gold is trading in the range of $2,850–$3,050 per troy ounce, having consolidated after its explosive rally in late 2024 and 2025. Silver is hovering around $34–$38 per ounce, and platinum — the often-overlooked sibling — is making a quiet comeback near the $1,100–$1,250 zone.
Why does this matter? Because the gold-to-silver ratio (GSR) — a classic metric traders use — is currently sitting around 78–82. Historically, when the GSR is this high, it often signals that silver is undervalued relative to gold. That’s not a guarantee, but it’s a data point worth keeping in your mental toolkit.
🌐 The Macro Forces Driving Precious Metals in 2026
You can’t look at metals in a vacuum. Here’s what’s actually pushing these markets right now:
Central Bank Buying Continues: The World Gold Council reported that central banks — particularly from China, India, Poland, and Turkey — purchased over 1,000 metric tons of gold for the third consecutive year in 2025. This institutional demand acts as a structural floor under prices.
U.S. Dollar Uncertainty: With ongoing debates around U.S. debt ceilings and the Fed’s complex balancing act between fighting residual inflation and avoiding recession, investors are still treating gold as a hedge against dollar weakness.
Geopolitical Risk Premium: Ongoing tensions in Eastern Europe and the South China Sea are keeping a “fear premium” baked into gold prices. This isn’t going away anytime soon.
Green Energy Demand for Silver: This is the underrated story of 2026. Silver is a critical industrial metal used in solar panels, EV batteries, and semiconductor components. Demand from clean energy manufacturing is putting a structural bid under silver that didn’t exist 10 years ago.
ETF Inflows Recovering: After significant outflows in 2023–2024, gold ETFs globally have seen renewed inflows in 2025–2026, suggesting retail and institutional investors are returning to the trade.
🇰🇷 Korea’s Precious Metals Market: A Local Lens
Back home in Korea, the conversation around precious metals investing has evolved significantly. The Korea Exchange (KRX) Gold Market — launched years ago as a transparent, tax-advantaged way to buy gold — has seen trading volume surge in 2025 and into 2026. Korean investors, particularly in the 30–50 age bracket, are increasingly treating gold as a core portfolio diversifier rather than just a savings vehicle their grandparents used.
Meanwhile, Korean gold savings accounts offered by banks like KB Kookmin and Shinhan have expanded their digital interfaces, making it easier than ever to accumulate gold in small increments — even from ₩10,000 at a time. This “micro-investment” approach to precious metals is a genuine game-changer for accessibility.
🌍 Global Examples Worth Noting
India, the world’s second-largest gold consumer, launched new Sovereign Gold Bond (SGB) tranches in 2025–2026 that include enhanced digital redemption features, making it easier for young Indians to invest without physically holding metal. The take-up rate among millennials has been remarkable.
In Europe, Swiss-based platforms like Kinesis Money and BullionVault have reported record user growth in 2025, as Europeans sought hard-asset exposure amid euro volatility. Germany — traditionally a gold-hoarding nation — saw private household gold holdings reach a new record estimated at over 9,000 metric tons.
🤔 So… Should You Actually Invest Right Now?
Here’s where I want to think through this with you honestly, rather than just cheerlead. Precious metals are not a get-rich-quick asset. They don’t pay dividends, they have storage costs (if physical), and they can go sideways for years. But they serve a very specific purpose: portfolio insurance and purchasing power preservation.
The question isn’t “will gold go up next month?” The better question is: “If my other assets — stocks, real estate, currency — all face stress at the same time, what do I have that holds value?” Gold has historically answered that question well.
💡 Realistic Investment Alternatives by Budget & Risk Profile
Budget Beginners (under ₩500,000 / ~$350): Start with a gold savings account at a major Korean bank or a fractional gold ETF like KODEX Gold Futures (available on KRX). You get exposure without the hassle of storage.
Intermediate Investors (₩1M–₩10M range): Consider a split approach — 60% physical gold (1g or 3.75g coins/bars from KRX or reputable dealers), 40% silver ETF exposure. This diversifies within the precious metals space.
Advanced/Serious Investors: Look at internationally listed mining ETFs (e.g., GDX or GDXJ on NYSE) for leveraged exposure to gold prices. But understand: miners carry operational risk beyond just metal prices. Also consider platinum for its industrial upside story tied to hydrogen fuel cell technology.
Ultra-Conservative Savers: If you’re nervous about volatility, a gold savings account with monthly automatic investment (similar to DCA — Dollar Cost Averaging) removes the stress of timing the market entirely.
⚠️ Things to Watch in the Rest of 2026
Fed interest rate trajectory — rate cuts tend to be bullish for gold
Chinese economic stimulus scale — China’s demand can move markets
Silver supply deficit data (Silver Institute mid-year report expected Q2 2026)
U.S. election cycle aftereffects on fiscal policy and dollar strength
Green energy manufacturing expansion — watch solar and EV production numbers
The precious metals space in 2026 isn’t about panic-buying or chasing momentum. It’s about understanding why these assets exist in a portfolio and giving them an appropriate role — not too much, not too little. Most financial advisors suggest keeping precious metals at 5–15% of a total portfolio, depending on your risk tolerance and investment horizon.
Mina from our opening story? She didn’t go all-in. She allocated about 10% of her savings to gold — and that measured, thoughtful approach is exactly why she’s sleeping well tonight.
Editor’s Comment : Precious metals in 2026 sit at a genuinely interesting intersection of macro uncertainty, industrial demand transformation, and renewed retail interest. The key insight that often gets lost in the noise: gold and silver aren’t competing with your stock portfolio — they’re complementing it. If you haven’t revisited your exposure to hard assets this year, now is a good time to have that conversation with yourself (or your financial advisor). Start small, stay consistent, and let the data — not the headlines — guide your decisions.
얼마 전 지인 한 명이 조심스럽게 물어왔어요. “요즘 금값이 너무 올랐는데, 지금이라도 사야 하나요? 아니면 이미 늦은 건가요?” 사실 이 질문, 2026년 현재 수많은 사람들이 똑같이 하고 있는 질문이라고 봅니다. 지정학적 불안과 달러 약세, 거기에 각국 중앙은행의 금 매입 러시까지 겹치면서 귀금속 시장이 그 어느 때보다 뜨겁게 달아오르고 있는 상황이거든요. 금과 은, 지금 어떤 상태인지 함께 찬찬히 살펴볼게요.
📊 2026년 귀금속 시세, 숫자로 먼저 보기
2026년 3월 기준, 국제 금 현물 가격(XAU/USD)은 트로이온스당 약 3,200~3,350달러 수준을 오가고 있습니다. 2024년 초 2,000달러 초반대였던 것과 비교하면 불과 2년여 만에 50% 이상 상승한 셈이에요. 국내 KRX 금 시장에서도 1g당 14만 원대 후반~15만 원대 초반을 기록하며 역대 최고가 경신을 이어가고 있는 상황입니다.
은(Silver)은 어떨까요? 국제 은 현물 가격(XAG/USD)은 트로이온스당 약 34~38달러 구간에서 움직이고 있어요. 금에 비해 변동성이 훨씬 크다는 게 은의 특성인데, 올해 들어서만 변동폭이 15%를 넘기도 했습니다. 이른바 ‘금은비율(Gold-Silver Ratio)’은 현재 약 88~95 수준으로, 역사적 평균인 60~70보다 훨씬 높아 은이 상대적으로 저평가되어 있다는 분석도 나오고 있어요.
🌍 왜 이렇게 오르는 걸까? 배경 분석
단순히 “불안하니까 금을 산다”는 심리적 요인만으로 설명하기엔 부족한 것 같습니다. 2026년 귀금속 강세 배경에는 복합적인 구조적 요인이 깔려 있거든요.
중앙은행 금 매입 지속: 세계금협회(WGC) 데이터에 따르면, 중국·인도·폴란드·체코 등 신흥국 중앙은행들이 2025년에 이어 2026년에도 공격적인 금 매입을 이어가고 있습니다. 달러 패권 의존도를 낮추려는 ‘탈달러화(De-dollarization)’ 전략의 일환으로 봐야 할 것 같아요.
미 연준의 금리 인하 기조: 2026년 초 미 연준(Fed)이 추가 금리 인하를 단행하면서 달러 인덱스(DXY)가 약세로 전환됐어요. 금리와 금값은 역의 상관관계를 가지는 경향이 있기 때문에, 금리 하락 = 금값 상승의 흐름이 나타나고 있는 것이라고 봅니다.
지정학적 리스크 상존: 중동 정세 불안과 미중 무역 갈등이 완전히 해소되지 않은 상태에서 안전자산 수요가 꾸준히 유입되고 있습니다.
은의 산업 수요 증가: 은은 금과 달리 태양광 패널, 전기차 배터리, 반도체 등 산업용 수요가 전체 소비의 50% 이상을 차지해요. 글로벌 친환경 전환 가속화로 인해 공급 부족 우려가 가격을 밀어올리는 요인으로 작용하고 있습니다.
ETF 및 개인 투자자 유입: 금·은 ETF로의 자금 유입이 2026년 1분기에도 강하게 나타나고 있어요. 특히 국내에서도 ‘KODEX 골드선물(H)’, ‘ACE KRX금현물’ 등 관련 상품 거래량이 눈에 띄게 늘었습니다.
🇰🇷 국내 귀금속 투자 방법, 어떤 선택지가 있을까?
귀금속 투자는 생각보다 다양한 방식으로 접근할 수 있습니다. 각각의 특성을 이해하고 본인 상황에 맞는 방법을 고르는 게 중요할 것 같아요.
KRX 금 현물 시장: 한국거래소에서 실물 금을 주식처럼 사고팔 수 있는 방식이에요. 매매차익에 대해 비과세(양도소득세 면제) 혜택이 있고, 부가세도 붙지 않아 세제상 가장 유리한 방법 중 하나라고 봅니다. 최소 1g 단위로 거래 가능해요.
금·은 ETF: 선물 기반 ETF와 현물 기반 ETF로 나뉘어요. 접근성이 높고 소액 투자가 가능하지만, 배당소득세(15.4%) 과세 대상이라는 점을 염두에 둬야 합니다. 환헤지(H) 여부도 꼭 확인하세요.
은행 골드뱅킹: 통장에 금을 ‘적립’하는 개념인데요, 매매 시 배당소득세와 환차손 위험이 존재하고 실물 인출 시 부가세가 붙는 구조라 상대적으로 비효율적일 수 있습니다.
실물 금·은 직접 매입: 한국조폐공사나 귀금속 전문점을 통한 구매인데, 유통 마진과 부가세(10%)가 붙어 즉시 수익을 내기 어렵다는 단점이 있어요. 장기 보유나 자산 증여 목적에 더 어울리는 방법인 것 같습니다.
금·은 관련 채굴주 투자: 뉴몬트(Newmont), 배릭골드(Barrick Gold) 같은 해외 광산 기업 주식에 투자하는 방법이에요. 레버리지 효과가 있어 금값 상승 시 주가가 더 크게 오를 수 있지만, 기업 리스크도 함께 감수해야 합니다.
🤔 지금 진입해도 괜찮을까? 현실적으로 따져보기
솔직히 말씀드리면, 이미 많이 오른 상황에서 진입하는 건 심리적으로 부담이 되는 게 사실이에요. 그런데 귀금속, 특히 금은 단기 트레이딩보다 포트폴리오의 10~15% 수준 내에서 리스크 분산 자산으로 접근하는 게 더 합리적이라는 게 많은 전문가들의 공통된 시각입니다.
한 번에 몰빵하기보다는 분할 매수(Dollar-Cost Averaging) 전략을 써서 매월 일정 금액을 꾸준히 매수하는 방식이 현실적인 대안인 것 같아요. 금은비율이 여전히 역사적 고점 수준에 있는 만큼, 가격 메리트 측면에서는 은이 금보다 조금 더 매력적인 구간일 수 있다고 봅니다. 단, 은의 높은 변동성은 반드시 감안해야 해요.
에디터 코멘트 : 귀금속 투자는 ‘대박을 노리는 자산’이 아니라 ‘내 자산을 지키는 방패’에 가깝다고 생각해요. 주식이나 코인처럼 짜릿한 단기 수익을 기대하기보다는, 인플레이션과 불확실성으로부터 자산 가치를 보존하는 역할로 접근하는 게 맞는 것 같습니다. 2026년 지금, 포트폴리오에 금이나 은이 한 자리도 없다면 작은 금액이라도 KRX 금 현물 시장부터 시작해 보는 건 어떨까요? 세금 혜택도 있고, 문턱도 낮으니까요. 단, 투자는 항상 본인의 상황과 리스크 허용 범위 안에서 결정하시길 바랍니다.
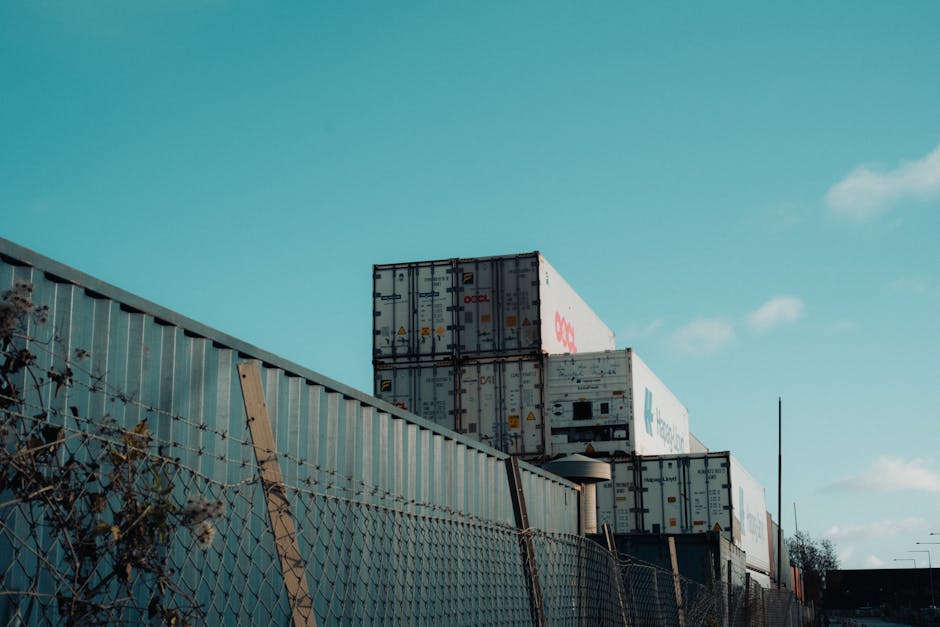
Picture this: it’s early 2026, and a small bakery owner in Seoul notices that the price of wheat flour has jumped nearly 28% compared to just eighteen months ago. She’s not alone. From construction contractors in Texas struggling with soaring steel costs to electronics manufacturers in Vietnam watching copper prices climb to record highs — the 2026 raw material price surge is quietly rewriting the rules of the global economy. Let’s think through this together, because understanding why it’s happening is just as important as knowing what to do about it.
What’s Actually Driving Raw Material Prices Higher in 2026?
This isn’t a single-cause story. The 2026 commodity price surge is the product of several overlapping pressures that have been building since the early 2020s and are now converging with full force.
Energy transition demand: The global push toward EVs, solar panels, and wind turbines has dramatically increased demand for lithium, cobalt, nickel, and copper. The International Energy Agency (IEA) estimates that copper demand alone could rise by 40% by 2030, and markets are already pricing that in — with copper trading above $11,500 per metric ton as of Q1 2026.
Geopolitical supply disruptions: Ongoing tensions in key mining regions — including parts of Sub-Saharan Africa and South America — have constrained supply chains for critical minerals. Trade policy friction between major economies has further complicated import-export flows.
Climate-related agricultural shocks: Extreme weather events in 2025 damaged harvests across Southeast Asia, South Asia, and parts of the U.S. Midwest. Rice, wheat, and soybean prices have all responded sharply upward.
Dollar strength and currency pressure: A relatively strong U.S. dollar in early 2026 has made commodity imports more expensive for emerging market economies, amplifying inflationary pressure locally even when global prices stabilize temporarily.
Logistics bottlenecks: Red Sea shipping disruptions that began in 2024 have proven stubbornly persistent, keeping freight costs elevated and delaying raw material delivery timelines.
The Macroeconomic Ripple Effects: More Than Just Higher Prices
Here’s where it gets really interesting — and a little sobering. Raw material price increases don’t stay neatly contained in commodity markets. They cascade through virtually every layer of the economy through what economists call cost-push inflation.
When steel prices rise, construction costs follow. When construction costs rise, housing becomes less affordable. When housing affordability falls, consumer spending on discretionary goods drops. That chain reaction is exactly what central banks in the U.S., EU, and South Korea are watching nervously right now. The U.S. Federal Reserve, which had been cautiously easing rates through late 2025, has signaled a “pause and reassess” stance for 2026 — largely because commodity-driven inflation threatens to undo the progress made in previous years.
For businesses, the math is brutal: either absorb the cost (crushing margins) or pass it to consumers (risking demand destruction). Most mid-sized companies are caught somewhere uncomfortably in between.
Real-World Examples: From Seoul to São Paulo
Let’s ground this in reality with some concrete examples from 2026.
South Korea — The Tech Manufacturing Squeeze: South Korea, one of the world’s leading semiconductor and EV battery producers, is feeling the pinch acutely. POSCO, the country’s largest steelmaker, reported a 19% increase in iron ore procurement costs in its Q4 2025 earnings report, with further pressure expected in 2026. Downstream, mid-tier electronics manufacturers are struggling to maintain the price competitiveness that made them attractive to global buyers in the first place. The Korean government has responded with targeted raw material stockpiling programs and fast-tracking free trade agreement updates with resource-rich nations.
United States — Construction and Housing: In the U.S., the National Association of Home Builders reported in February 2026 that material costs now account for nearly 62% of new home construction expenses — a historic high. Lumber, copper wiring, and aluminum framing have all seen double-digit year-over-year price increases. This directly constrains housing supply at a time when inventory is already critically low in major metro areas.
Brazil — The Commodity Producer Paradox: Interestingly, Brazil — a major exporter of iron ore, soybeans, and oil — is experiencing something of a two-speed economy. Export revenues are booming, but domestic consumers are still facing food price inflation because global commodity prices pull local agricultural products toward export markets, reducing domestic supply. It’s a paradox that commodity-exporting nations know all too well.
What Can Households and Businesses Realistically Do?
Alright, let’s shift from diagnosis to strategy — because understanding the problem without actionable alternatives isn’t very useful, is it?
For households: Focus on locking in fixed-rate contracts where possible (mortgages, utility plans). Consider diversifying savings into commodity-linked assets like ETFs tracking energy or metals indices — not as speculation, but as a modest inflation hedge. Reducing single-point-of-supply dependency in your personal budget (e.g., diversifying grocery sources, buying in bulk on staples when prices dip) can smooth out volatility.
For small business owners: Review supplier contracts now. Renegotiating to include price adjustment clauses tied to commodity indices can protect both sides. Explore material substitution where feasible — for example, some manufacturers are shifting partially from copper wiring to aluminum alternatives in non-critical applications.
For investors: Commodity price cycles don’t last forever, but they do tend to be stickier than equity corrections. Diversifying across sectors and geographies, with meaningful exposure to resource producers and green energy infrastructure companies, may offer both growth potential and inflation resilience in 2026’s environment.
For policymakers (thinking macro): Strategic mineral reserves, accelerated permitting for domestic mining, and bilateral resource-sharing agreements are the levers being pulled in 2026. The EU’s Critical Raw Materials Act is a strong model worth watching for its real-world effectiveness.
The Longer View: Is This a Cycle or a Structural Shift?
This is probably the most important question of 2026 for anyone thinking about long-term planning. The honest answer? It’s both — and that’s what makes it tricky. Short-term supply disruptions will eventually ease, as they always do. But the structural demand created by the energy transition is not going away. Copper, lithium, and rare earth elements will remain under sustained demand pressure for at least the next decade. That means the “return to normal” that many businesses are waiting for may be a new normal — one where raw material costs are simply higher than the pre-2020 baseline that everyone got used to.
Adapting to that reality — through technology, efficiency, material innovation, and smarter supply chain design — is the real competitive frontier of the 2020s.
Editor’s Comment : The 2026 commodity price surge is genuinely one of those slow-moving crises that’s easy to tune out until it’s sitting right on your doorstep — or in your grocery receipt. What I find most worth remembering is that these pressures, while real and significant, are also signaling a deeper economic transformation that’s creating genuine opportunities alongside the challenges. The businesses and households that will navigate 2026 best aren’t the ones waiting for prices to fall back to 2019 levels — they’re the ones building resilience and flexibility into every decision they make right now. Stay curious, stay adaptable, and keep asking “why” before you react to the headlines.
얼마 전 지인이 카페를 운영하는데, 원두 납품 단가가 6개월 만에 30% 가까이 올랐다며 한숨을 쉬었어요. 메뉴 가격을 올리자니 손님이 줄까 걱정되고, 그냥 버티자니 마진이 너무 빠듯하다고요. 사실 이건 단순히 커피 한 잔의 이야기가 아니에요. 2026년 현재, 에너지·금속·농산물 등 거의 모든 원자재 카테고리에서 가격 압력이 동시에 올라오고 있고, 그 파동이 우리 일상과 거시경제 전반으로 퍼져 나가고 있다고 봅니다.
오늘은 이 흐름이 왜 지금 다시 거세졌는지, 그리고 우리는 이 상황을 어떻게 읽고 대비할 수 있는지 함께 살펴볼게요.
📊 본론 1 — 숫자로 읽는 2026 원자재 시장의 현주소
2026년 1분기 기준, 주요 원자재 가격 흐름을 살펴보면 몇 가지 두드러진 패턴이 보여요.
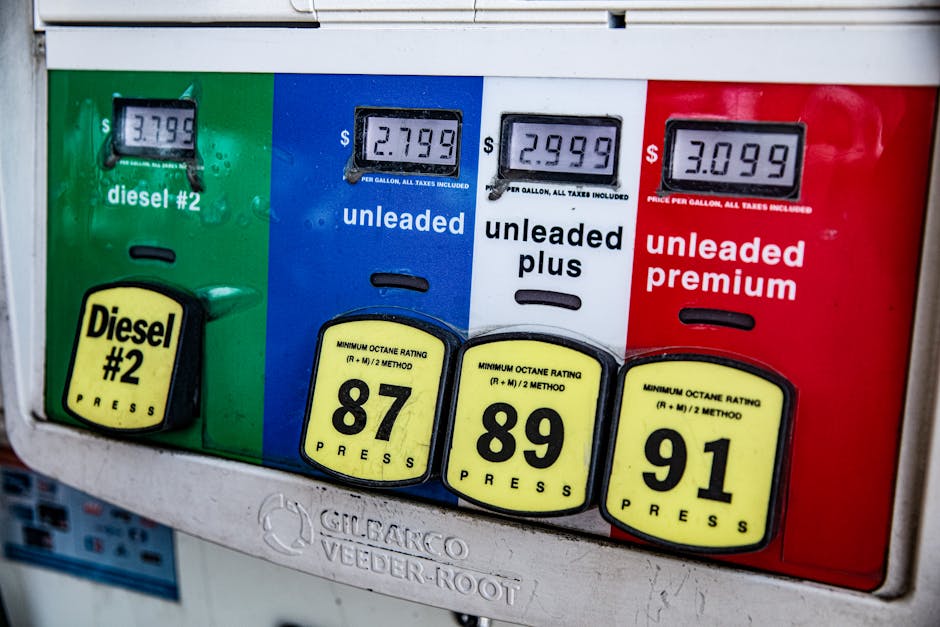
에너지(WTI 원유): 배럴당 95~100달러 선을 오가며 2년래 최고 수준에 근접. 중동 지역 지정학적 불안과 OPEC+ 감산 기조가 맞물린 결과라고 봅니다.
구리(LME 기준): 톤당 10,500달러 전후로, AI 데이터센터 확대 및 전기차 인프라 투자 급증이 수요를 끌어올리고 있어요.
금(Gold): 온스당 3,100달러 이상을 기록하며 안전자산 선호 현상이 뚜렷하게 나타나고 있습니다.
밀·옥수수 등 곡물류: 라니냐 기후 패턴이 남미·호주 수확량에 타격을 주면서 전년 대비 15~20% 수준의 가격 상승이 관측되고 있어요.
천연가스(유럽 TTF 기준): MWh당 50유로 이상을 재돌파하며 유럽 산업계의 에너지 비용 부담이 재차 가중되는 상황입니다.
이 숫자들이 단순한 시장 통계로 보일 수 있지만, 실제로는 ‘생산자물가지수(PPI)→소비자물가지수(CPI)→금리 정책’으로 이어지는 거시경제 연쇄 반응의 출발점이에요. PPI가 오르면 기업들은 원가 부담을 소비자 가격에 전가하게 되고, CPI 상승은 중앙은행의 긴축 기조 유지 또는 강화로 이어질 수 있거든요.
🌍 본론 2 — 국내외에서 실제로 벌어지고 있는 일들
🇰🇷 한국의 경우, 원자재 수입 의존도가 매우 높은 경제 구조상 타격이 빠르게 체감됩니다. 에너지 수입 비용 증가로 무역수지 적자 압력이 재현될 수 있고, 특히 석유화학·철강·반도체 소재 산업은 원재료비 상승에 민감하게 반응해요. 2026년 초 한국은행이 기준금리를 신중하게 관리하는 배경 중 하나도 바로 이 ‘수입 인플레이션(imported inflation)’ 리스크 때문이라고 봅니다.
🇺🇸 미국의 경우, 연준(Fed)은 2025년 하반기부터 시작한 점진적 금리 인하 기조를 원자재발 인플레이션 재점화 우려로 인해 속도 조절 중인 것으로 알려져 있어요. ‘라스트 마일 인플레이션(last-mile inflation)’이라는 표현이 다시 시장에서 회자되고 있을 정도입니다.
🇩🇪 독일을 비롯한 유럽은 에너지 가격 재상승으로 제조업 경쟁력 약화가 심화되고 있어요. 유럽의 주력 산업인 자동차·화학 분야 기업들이 생산 비용 절감을 위해 아시아 및 북미로 투자를 분산하는 ‘탈유럽화’ 흐름도 감지되고 있습니다.
🇨🇳 중국은 구리·리튬 등 핵심 광물을 전략적으로 비축하면서 글로벌 공급망에서의 레버리지를 유지하려는 움직임이 뚜렷해요. 이는 단순한 시장 수요가 아니라 지경학(geoeconomics)적 판단이 반영된 것이라고 볼 수 있습니다.
💡 결론 — 우리가 취할 수 있는 현실적인 대응 방향
원자재 가격 상승 자체를 개인이나 소규모 사업자가 막을 수는 없어요. 하지만 이 흐름을 이해하고 미리 준비하는 것과 아닌 것은 꽤 큰 차이를 만들어 낼 수 있다고 봅니다.
개인 재테크 측면: 원자재 가격 상승기에는 금(Gold) ETF, 에너지 관련 인프라 리츠(REITs), 원자재 관련 펀드가 인플레이션 헤지 수단으로 주목받는 경향이 있어요. 단, 변동성이 크므로 포트폴리오의 일부로만 편입하는 것이 현실적인 접근이라고 봅니다.
소상공인·자영업자: 원재료 가격 연동형 공급 계약 조건을 검토하거나, 복수 공급처를 확보해 리스크를 분산하는 것이 중요해요. 가격 전가 타이밍을 너무 늦추면 마진 구조가 장기적으로 훼손될 수 있습니다.
기업 구매·전략 담당자: 원자재 선물 헤징(hedging) 전략과 함께, 공급망 다각화(supply chain diversification)를 본격적으로 검토할 시점이라고 봅니다.
거시 흐름 관찰자로서: CPI 발표, OPEC 회의 일정, 주요 곡창지대 기상 예보 등을 주기적으로 체크하면 경제 흐름을 앞서 읽는 데 도움이 됩니다.
결국 2026년의 원자재 가격 상승은 지정학적 리스크, 기후 변화, 에너지 전환 수요, 공급망 재편이라는 구조적 요인들이 복합적으로 얽힌 결과예요. 단기 사이클로만 보기엔 그 뿌리가 꽤 깊다는 게 제 시각입니다.
에디터 코멘트 : 원자재 상승장은 항상 ‘강한 자에게 유리하고 약한 자에게 가혹한’ 구조를 만들어 냅니다. 대형 기업은 헤징 수단이 있지만, 소규모 사업자나 신흥국 소비자들은 그 충격을 고스란히 받게 되죠. 지금 이 흐름이 일시적 노이즈인지 구조적 전환인지를 판별하는 것이 2026년 하반기 경제 전망에서 가장 핵심적인 질문이 될 것 같습니다. 조금이라도 일찍, 조금이라도 넓은 시야로 바라보는 것이 지금 우리가 할 수 있는 최선이라고 봐요.
A friend of mine — let’s call her Dana — came to me last autumn buzzing with excitement. She’d just read a newsletter claiming that investing in agricultural commodities like wheat, soybeans, and corn was “the smartest hedge against inflation in 2026.” She was ready to dump a significant chunk of her savings into a commodity ETF before the week was out. I asked her one simple question: “Do you know what drives the price of soybeans on any given Tuesday?” She paused. That pause probably saved her from a very turbulent ride.
Agricultural commodity investing — or nongsan mul wontjaejae (농산물 원자재) investing, as it’s commonly referenced in Korean financial discussions — is genuinely fascinating and potentially rewarding. But it’s also one of the most complex, weather-dependent, geopolitically sensitive asset classes out there. Let’s think through this together, carefully and honestly.
What Exactly Are Agricultural Commodities?
Agricultural commodities are raw, unprocessed food and fiber products traded on global exchanges. The major categories include:
Grains & Oilseeds: Wheat, corn, soybeans, canola — these are the heavyweights, traded on the CME Group (Chicago Mercantile Exchange) and other global platforms.
Soft Commodities: Coffee, cocoa, cotton, sugar — more volatile due to narrower geographic production zones.
Livestock: Live cattle, lean hogs — tied closely to feed costs (which are themselves agricultural commodities).
Specialty Crops: Rice, palm oil, rubber — often more regionally significant (e.g., palm oil dominates Southeast Asian markets).
Investors access these primarily through futures contracts, commodity ETFs (like the Invesco DB Agriculture Fund, ticker DBA), agricultural stocks (seed companies, fertilizer producers), or farmland REITs. Each entry point carries a very different risk profile — something Dana hadn’t considered at all.
The 2026 Risk Landscape: What’s Actually Happening Right Now
Let me give you the honest picture of where we stand in early 2026:
Climate Volatility Is No Longer a Tail Risk — It’s the Baseline. The 2025 La Niña cycle created significant disruption in South American soybean and corn production, with Argentine soybean output down roughly 12% from the prior year. Meanwhile, the U.S. Midwest experienced an unusually dry planting season. These weren’t black swans; they were increasingly predictable patterns of unpredictability. If that sounds paradoxical, welcome to agricultural investing.
Geopolitical Supply Chain Fragility. The Russia-Ukraine agricultural corridor remains a persistent concern. Ukraine, historically one of the world’s top exporters of sunflower oil and corn, continues to operate under constrained export capacity as of Q1 2026. Black Sea shipping premiums remain elevated, adding a structural cost layer to global grain pricing that wasn’t present five years ago.
Currency Dynamics. A stronger U.S. dollar (which has shown periods of strength in early 2026) typically suppresses agricultural commodity prices because most are dollar-denominated — making them more expensive for international buyers and reducing demand. This is counterintuitive for many first-time commodity investors: a strong dollar can hurt your agricultural commodity position even when crop fundamentals look bullish.
Biofuel Policy Whiplash. U.S. Renewable Fuel Standard (RFS) mandates and the EU’s evolving biofuel blending requirements directly impact corn and palm oil demand. In late 2025, a partial rollback of U.S. ethanol blend mandates caused a notable dip in corn futures — a policy-driven move that had nothing to do with supply or weather.
Return Potential: The Numbers Worth Knowing
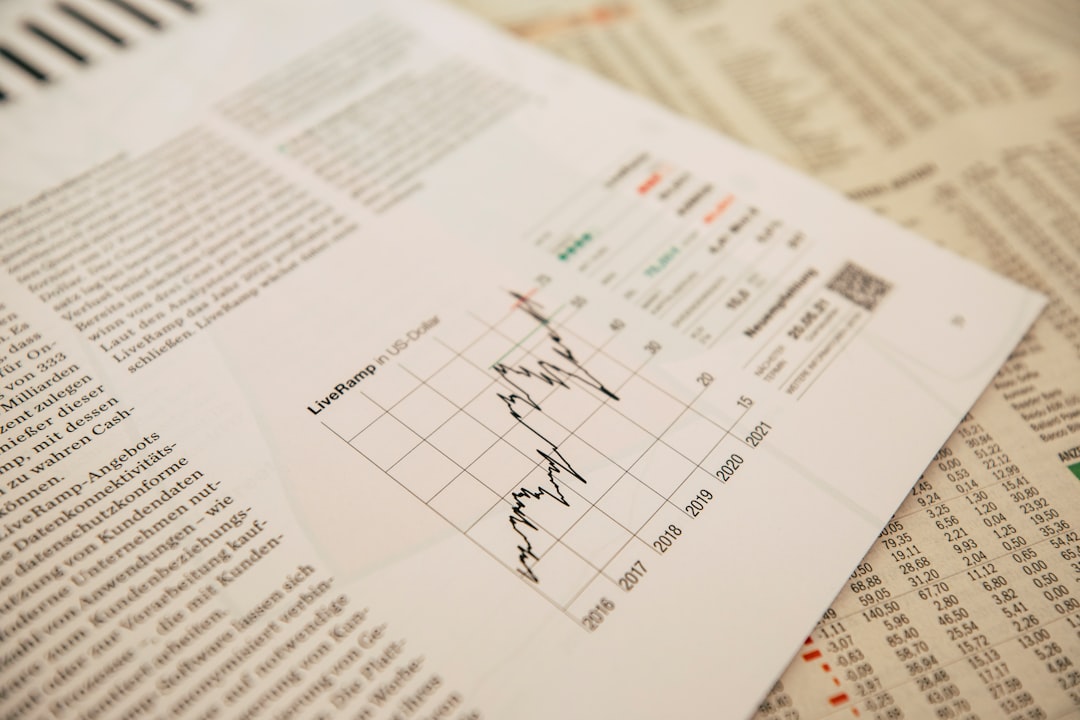
Now, the part investors love to focus on — and often over-focus on.
Looking at the Bloomberg Agriculture Subindex over the past decade, agricultural commodities have delivered average annualized returns of roughly 3–7%, but with standard deviation (a measure of volatility) that can exceed 20% in active years. Compare that to the S&P 500’s historical ~10% annualized return with roughly 15–17% standard deviation, and you start to see the risk-adjusted return story isn’t as straightforward as many newsletters suggest.
However, the compelling argument for agricultural commodities is their low correlation to traditional equity markets. During equity market crashes (like Q4 2022 or the AI valuation correction of mid-2025), certain agricultural commodities actually moved independently or even upward, providing genuine portfolio diversification. This is their real superpower — not necessarily high absolute returns, but returns that don’t move in lockstep with your stock portfolio.
Real-World Examples: Learning from Global and Domestic Cases
South Korea’s Strategic Agricultural Import Exposure (2025–2026): South Korea imports approximately 70% of its grain needs, making it one of the most agriculturally import-dependent OECD nations. In 2025, Korean food manufacturers like CJ CheilJedang and Daesang Corporation faced significant margin compression as global wheat and soybean prices spiked. Interestingly, some Korean institutional investors who had hedge positions in agricultural futures through commodity funds actually offset these operational losses — a textbook example of commodity investing as a business hedge, not just speculation.
The Coffee Rollercoaster of 2024–2026: Arabica coffee prices hit multi-decade highs in late 2024 due to drought in Brazil and Vietnam (the world’s top two producers). Investors who entered coffee futures positions in mid-2024 saw extraordinary short-term gains — only to watch prices partially correct through 2025 as Brazilian rains returned and speculative positions unwound. This cycle perfectly illustrates the mean reversion tendency in agricultural commodities: extreme weather creates price spikes, but production eventually responds, pulling prices back down.
Farmland REITs as a Quieter Alternative: U.S.-based Farmland Partners (FPI) and Gladstone Land Corporation (LAND) have attracted growing interest from investors who want agricultural exposure without futures volatility. These REITs own physical farmland leased to farmers, generating rental income. Their 2025 performance was notably more stable than direct commodity futures, though they come with their own liquidity constraints and interest rate sensitivity.
The Hidden Costs Nobody Talks About
This deserves its own section because it’s where many retail investors get quietly eroded:
Roll Yield Drag: When you invest in commodity futures ETFs, the fund must regularly “roll” expiring futures contracts into new ones. When future prices are higher than current prices (a condition called contango), this rolling process creates a persistent cost drag that can significantly underperform the spot commodity price. Agricultural markets frequently experience contango.
Storage and Logistics Costs: Unlike gold, you can’t physically store soybeans in your closet. The cost of physical delivery, warehousing, and transportation is built into futures pricing and can eat into returns.
ETF Management Fees: Commodity ETFs typically charge 0.75–1.0% in annual fees — higher than most equity index funds. Over time, this compounds negatively.
Tax Treatment Complexity: In many jurisdictions, commodity futures gains are taxed differently than equity gains. In the U.S., for example, futures contracts often fall under the “60/40 rule” (60% long-term, 40% short-term capital gains treatment regardless of holding period). Non-U.S. investors face additional treaty and withholding complexities.
Realistic Alternatives Worth Exploring
Here’s where I want to be genuinely helpful rather than just painting a scary picture. If you’re interested in agricultural commodity exposure but the direct risks feel too complex, consider these structured alternatives:
1. Agricultural Equity ETFs: Funds like the VanEck Agribusiness ETF (MOO) invest in companies across the agricultural value chain — seed producers, fertilizer manufacturers, farm equipment companies like Deere & Co., and food processors. You get indirect agricultural exposure with equity-level liquidity and without futures roll costs. The trade-off: you’re also exposed to company-specific management risk.
2. Diversified Real Asset Funds: Many balanced portfolios now include a “real assets” allocation (5–10%) that blends farmland, timberland, infrastructure, and commodities. This diversification within the real assets bucket smooths volatility considerably.
3. Inflation-Linked Bonds with Agricultural Tilt: TIPS (Treasury Inflation-Protected Securities) in the U.S. or similar instruments in Korea (물가연동국채) don’t directly track agricultural prices but protect against broad inflation — which agricultural commodity spikes often feed into. For risk-averse investors, this can be a cleaner inflation hedge.
4. Targeted Position Sizing: If you do want direct commodity exposure, financial planning consensus generally suggests limiting speculative commodity positions to no more than 5–10% of a total portfolio. Dana, after our conversation, allocated 6% to a diversified agricultural ETF — a position she can monitor without losing sleep.
The agricultural commodity space in 2026 is genuinely complex — shaped by climate science, geopolitics, monetary policy, and biological cycles all at once. That complexity isn’t a reason to avoid it entirely; it’s a reason to approach it with clear eyes, appropriate position sizing, and a realistic understanding of what you’re actually buying. The investors who do best in this space tend to treat it as a portfolio tool, not a get-rich-quick lever.
Editor’s Comment : Agricultural commodities are one of those rare asset classes where the more you learn, the more humbled you become — and that humility is actually your best risk management tool. If you’re just starting out, spending 30 minutes understanding what contango means in a futures ETF will do more for your returns than any market timing strategy. Think of agricultural investing as a relationship with the natural world — unpredictable, occasionally spectacular, and definitely requiring patience.
지인 중 한 명이 2년 전쯤 ‘코코아 선물(Futures)’에 투자했다가 꽤 짭짤한 수익을 올렸다는 이야기를 들은 적이 있어요. 당시 서아프리카 이상기후로 코코아 공급이 급감했고, 가격이 불과 몇 달 만에 두 배 가까이 뛰었거든요. 그 이야기를 들은 주변 사람들이 너도나도 농산물 원자재 투자에 관심을 갖기 시작했는데, 막상 뛰어든 분들 중 상당수는 예상치 못한 손실을 봤다고 합니다. 이게 단순한 운의 문제였을까요? 아마도 아닐 거라고 봅니다. 농산물 원자재는 매력적인 수익 잠재력과 동시에 다른 자산군에서는 좀처럼 보기 힘든 독특한 리스크 구조를 가지고 있거든요. 오늘은 그 구조를 찬찬히 뜯어보면서, 2026년 현재 시점에서 어떻게 접근하는 게 현실적인지 함께 고민해 보려 해요.
📊 농산물 원자재 시장, 숫자로 보면 어떨까요?
우선 시장 규모부터 짚어볼게요. 글로벌 농산물 원자재 시장(Soft Commodities Market)은 2026년 현재 연간 거래 규모 기준으로 약 2조 달러 이상으로 추산되고 있어요. 시카고상품거래소(CME)와 런던국제금융선물거래소(ICE)가 대표적인 거래 플랫폼이고요.
수익률 측면에서 보면, 최근 5년간(2021~2025) 농산물 상품 지수(S&P GSCI Agriculture Index) 누적 수익률은 약 +62%에 달했어요. 같은 기간 미국 S&P 500이 약 +80% 수준이었다는 점을 고려하면 주식보다 낮아 보이지만, 상관관계(Correlation)가 낮다는 점에서 포트폴리오 분산 효과는 상당하다고 볼 수 있어요.
하지만 연도별로 쪼개서 보면 얘기가 달라져요. 2022년 한 해만 해도 밀(Wheat) 선물 가격은 우크라이나-러시아 전쟁 여파로 연초 대비 +60% 이상 급등했다가, 연말에는 다시 -35% 하락하는 극단적인 변동성을 보였거든요. 변동성 지표(Volatility)로 보면 농산물 원자재의 연간 가격 변동성은 평균 20~45% 수준으로, 일반 주식(약 15~20%)보다 훨씬 높은 경우가 많아요.
🌦️ 농산물 투자 특유의 리스크 구조
농산물 원자재 투자를 어렵게 만드는 건 단순한 가격 변동 그 이상이에요. 크게 세 가지 층위의 리스크가 중첩되어 있다고 봅니다.
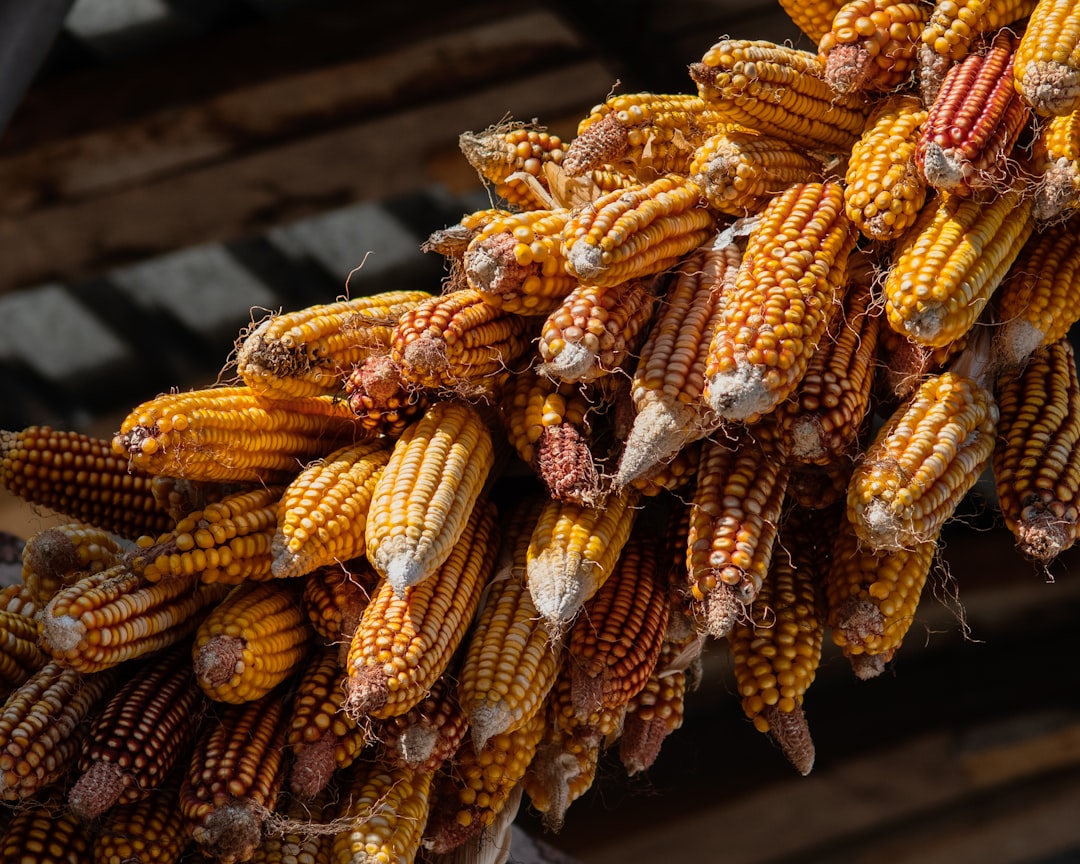
기후·자연재해 리스크: 엘니뇨(El Niño), 라니냐(La Niña) 같은 기후 패턴 변화는 밀, 옥수수, 대두의 작황에 직접적인 영향을 미쳐요. 2025~2026 시즌에도 남미 주요 곡창지대의 가뭄으로 대두 수급이 불안정한 상황이 이어지고 있어요.
롤오버 비용(Roll Cost) 리스크: 선물 기반 상품에 투자할 경우, 만기가 지난 계약을 다음 달 계약으로 교체(Roll Over)하는 과정에서 발생하는 비용이 누적돼요. 이른바 ‘콘탱고(Contango)’ 상태가 장기간 유지되면, 현물 가격이 오르더라도 선물 투자자는 오히려 손실을 볼 수 있어요.
지정학적·정책 리스크: 주요 생산국의 수출 금지, 보조금 정책, 환율 변동이 복합적으로 가격에 영향을 줍니다. 2026년 현재 인도의 쌀·밀 수출 규제 완화 여부가 아시아 곡물 시장의 주요 변수로 떠오르고 있어요.
환율 리스크: 농산물 원자재는 대부분 달러(USD) 기준으로 거래돼요. 원화 기준 국내 투자자라면 달러 강세 시 수익이 증폭되지만, 달러 약세 시엔 수익을 갉아먹는 구조예요.
레버리지 리스크: 선물 거래는 기본적으로 레버리지 상품이에요. 소액의 증거금(Margin)으로 큰 금액의 계약을 체결하기 때문에, 예상과 반대 방향으로 움직이면 원금을 초과하는 손실이 발생할 수도 있어요.
🌍 국내외 실제 사례로 보는 명암
[해외 사례 — 코코아 슈퍼사이클] 2023~2024년 코코아(Cocoa) 가격은 전례 없는 슈퍼사이클을 경험했어요. 서아프리카 가나·코트디부아르의 연속 흉작과 엘니뇨 여파가 겹치면서 코코아 선물 가격이 톤당 1만 달러를 돌파했고, 이는 역사적 최고치였어요. 이 흐름을 초반에 포착한 헤지펀드들은 수백 퍼센트의 수익률을 기록했지만, 2025년 중반 이후 공급 회복 기대감으로 가격이 급격히 조정되면서 뒤늦게 진입한 개인 투자자들은 큰 손실을 입었어요. 타이밍의 중요성을 보여주는 전형적인 사례라고 봅니다.
[국내 사례 — 농산물 ETF 투자 열풍] 국내에서는 2022~2023년 곡물 가격 급등기를 거치며 ‘KODEX 콩선물(H)’, ‘TIGER 소프트커머디티선물(H)’ 등 농산물 관련 ETF 거래량이 폭발적으로 늘었어요. 문제는 많은 투자자들이 앞서 언급한 롤오버 비용 구조를 충분히 이해하지 못한 채 투자했다는 점이에요. 현물 가격이 보합 내지 소폭 상승하는 구간에서도 ETF 가격은 꾸준히 하락하는 현상을 경험하면서, “왜 가격이 오르는데 내 수익은 줄지?”라는 의문을 품게 되는 경우가 많았어요.
💡 2026년 현재, 어떤 접근이 현실적일까요?
농산물 원자재 투자가 무조건 나쁘다는 게 아니에요. 다만 ‘어떻게 접근하느냐’에 따라 결과가 완전히 달라진다는 점을 강조하고 싶어요.
직접 선물 투자보다 ETF·ETN 활용: 개인 투자자라면 레버리지가 내재된 선물 직접 투자보다는 ETF나 ETN을 통한 간접 투자가 리스크 관리 측면에서 낫습니다. 단, 롤오버 비용이 발생하는 상품인지는 꼭 확인해야 해요.
농업 관련 주식으로 우회 투자: 곡물 가격 상승의 수혜를 받는 농업 기계 기업(예: 디어앤컴퍼니), 비료 회사(모자이크, 노르스크하이드로), 농산물 유통 기업(아처대니얼스미들랜드) 등의 주식은 직접적인 원자재 변동성보다 완충된 수익 구조를 가질 수 있어요.
포트폴리오 내 비중 제한: 농산물 원자재는 전체 투자 포트폴리오의 5~15% 이내로 제한하는 게 일반적으로 권고되는 비중이에요. 분산 투자 효과를 노리되, 과도한 집중은 피하는 게 좋습니다.
기후 데이터와 USDA 보고서 모니터링: 미국 농무부(USDA)가 매월 발표하는 세계 농업 수급 전망(WASDE) 보고서는 곡물 투자자라면 반드시 챙겨봐야 할 지표예요. 기후 변화 데이터와 함께 참고하면 큰 방향성을 잡는 데 도움이 돼요.
에디터 코멘트 : 농산물 원자재 투자는 ‘자연과 거래하는 것’이라는 표현이 꽤 적절한 것 같아요. 주식이나 채권처럼 기업의 실적이나 금리 흐름을 분석하는 논리만으로는 절대 해석이 안 되는 영역이거든요. 기후, 지정학, 수급, 환율이 뒤엉킨 복잡계예요. 그렇기에 소액으로 먼저 구조를 이해하고, 리스크를 체감해 본 뒤 비중을 늘려가는 방식이 가장 현실적인 접근이라고 봅니다. 고수익의 달콤함에 앞서, 내가 감당할 수 있는 변동성의 크기가 얼마인지를 먼저 스스로에게 물어보는 게 좋을 것 같아요.
태그: [‘농산물 원자재 투자’, ‘농산물 ETF’, ‘원자재 리스크’, ‘곡물 선물 투자’, ‘상품 투자 전략’, ‘2026 투자 트렌드’, ‘포트폴리오 분산’]
Picture this: It’s early January 2026, and you’re sipping your morning coffee while scrolling through your portfolio app. The numbers are moving — some up, some sideways — and you’re wondering, “Is this the year I finally get my investment strategy right?” You’re not alone. Millions of investors worldwide are asking the same question as markets continue to navigate a landscape shaped by post-rate-cycle adjustments, AI-driven productivity shifts, and geopolitical recalibrations that show no signs of slowing down.
Let’s think through this together — not with crystal-ball predictions, but with grounded, data-informed reasoning about where opportunities and risks realistically lie in 2026.
📊 Where the Numbers Stand: A Data-Driven Snapshot of Early 2026
As of March 2026, global equity markets have delivered a mixed but cautiously optimistic picture. The S&P 500 is hovering around the 5,800–6,100 range, having digested significant volatility from late 2025’s Federal Reserve policy recalibration. Meanwhile, the MSCI World Index has posted a modest year-to-date gain of approximately 4.2%, driven largely by technology and healthcare sectors.
Here’s what the macro environment actually looks like right now:
U.S. Federal Reserve: After a series of cuts through late 2025, the Fed has paused at a target rate of approximately 3.75–4.00%. Markets are pricing in one or two additional cuts in the second half of 2026 — but that’s far from guaranteed.
Eurozone: The ECB has been more aggressive in cutting rates to stimulate sluggish growth, sitting around 2.5%. European value stocks — particularly in industrials and financials — are attracting renewed attention as a result.
China’s A-share and Hong Kong Markets: Beijing’s stimulus packages from late 2025 are slowly filtering into consumer spending data. The MSCI China Index saw a bounce, but structural concerns around property sector debt and demographic headwinds keep institutional investors cautious.
Japan (Nikkei 225): Japan continues its quiet renaissance. The Bank of Japan’s gradual normalization of monetary policy has strengthened the yen modestly, and corporate governance reforms are making Japanese equities more appealing to global fund managers.
Emerging Markets (EM): India stands out as the structural growth story of 2026, with the Nifty 50 benefiting from demographic dividends, manufacturing reshoring, and digital infrastructure investment. Brazil and Southeast Asian markets like Vietnam and Indonesia are also on investor radars.
🤖 The AI Economy: Still a Market Driver, But With New Nuances
If 2024 and 2025 were about betting on who would build the AI infrastructure, 2026 is increasingly about identifying who will actually profit from deploying it. This is a critical distinction. The so-called “AI infrastructure trade” — semiconductors, data centers, power grids — remains relevant, but the next leg of the rally is being driven by enterprise software companies demonstrating real, measurable productivity gains from AI integration.
Companies in healthcare diagnostics, legal tech, and financial services that have successfully embedded AI into their workflows are showing margin expansion that’s catching institutional eyes. This is sometimes called the “AI monetization phase” — and it’s where savvy investors in 2026 are focusing their attention.
🌍 International Examples: Learning From What’s Already Happening
Let’s ground this in real-world case studies from across the globe:
South Korea’s KOSPI: Korea’s market has been navigating a complicated 2026. Samsung Electronics and SK Hynix continue to benefit from HBM (High Bandwidth Memory) demand for AI chips, giving the semiconductor sector a lift. However, geopolitical tension around the Taiwan Strait and sluggish domestic consumption have kept the broader KOSPI index range-bound. Korean retail investors — famous for their active participation — are increasingly diversifying into U.S. ETFs and Indian market funds.
Germany’s DAX: Germany’s industrial heartland continues to restructure. The DAX hit record highs briefly in Q1 2026 but faces headwinds from energy cost competitiveness and automotive sector disruption from Chinese EV brands. Interestingly, German defense and aerospace stocks have surged dramatically following continued EU defense spending commitments — a sector almost no one talked about five years ago.
India’s NSE Nifty 50: India is arguably the most compelling structural growth story in global equities right now. With a GDP growth rate projected at 6.5–7% for 2026, a young working-age population, and massive government infrastructure spending, foreign institutional investors (FIIs) have been net buyers of Indian equities throughout early 2026.
⚠️ The Risks You Shouldn’t Ignore
Being optimistic doesn’t mean being naive. Here are the key risk factors that could reshape the 2026 outlook:
Geopolitical flashpoints: The Taiwan Strait situation, Middle East energy supply concerns, and U.S.-China trade policy under the current administration all carry tail risk that markets can reprice very quickly.
Sticky inflation resurgence: If services inflation — particularly in the U.S. and UK — re-accelerates, central banks could be forced to pause or reverse rate cuts, which would be a significant headwind for growth stocks.
Commercial real estate debt: The slow-motion reckoning in global commercial real estate, especially U.S. office properties, poses systemic risk to regional banks and credit markets.
Currency volatility: A stronger-than-expected dollar could squeeze emerging market borrowers and dampen EM equity returns for USD-based investors.
AI hype cycle correction: If AI monetization takes longer than expected, we could see a rotation out of high-multiple tech stocks, similar to what happened with cloud stocks in 2022.
💡 Realistic Alternatives: What Should Different Investors Actually Do?
Here’s where we get practical. Not everyone has the same risk tolerance, time horizon, or financial situation — and a one-size-fits-all approach to global equities in 2026 is genuinely dangerous. Let’s think through a few realistic scenarios:
For conservative investors: Consider a barbell approach — allocating to dividend-paying developed market equities (think European financials or U.S. utilities) alongside short-duration bond funds. You’re not chasing the upside, but you’re protecting against the downside. Dividend aristocrats with consistent payouts are particularly attractive in a world where rate cuts are slow and uncertain.
For growth-oriented investors: Rather than picking individual AI stocks, consider thematic ETFs that capture the “AI monetization” trend — software-as-a-service companies with proven AI integration, healthcare AI diagnostics firms, and cybersecurity (which grows in tandem with AI adoption). India-focused ETFs are also worth a serious look for 5–10 year time horizons.
For investors concerned about U.S. concentration risk: The U.S. now represents over 65% of the MSCI World Index — a historically high concentration. Deliberately tilting your portfolio toward Japan, India, and select European sectors can provide meaningful diversification without abandoning developed market quality.
For beginners just getting started: Dollar-cost averaging (DCA) into a globally diversified ETF — something like a world equity index fund — remains one of the most reliably boring and effective strategies. The complexity of 2026 markets can feel overwhelming, but consistent, automated investing into broadly diversified funds removes the timing guesswork entirely.
🔮 The Bottom Line: 2026 Is a Year for Discipline Over Excitement
The 2026 global stock market is genuinely interesting — not in a “this is obviously going to the moon” way, but in a “there are real opportunities if you know where to look and what to avoid” way. The macro crosscurrents are complex: cooling-but-not-collapsing inflation, a Fed on pause, AI shifting from hype to selective profitability, and a multi-polar geopolitical world that demands geographic diversification.
The investors who will look back at 2026 with satisfaction won’t be the ones who made dramatic concentrated bets. They’ll be the ones who maintained discipline, diversified intelligently, and stayed curious enough to adjust as new information arrived.
Markets reward patience and penalize panic. That truth hasn’t changed — even in 2026.
Editor’s Comment : What strikes me most about the 2026 investment landscape is that the biggest risk for most people isn’t picking the wrong stock — it’s either sitting entirely in cash out of fear or over-concentrating in last year’s winners. The global market in 2026 is genuinely offering multiple interesting entry points across geographies and sectors. My honest advice? Build your framework first (risk tolerance, time horizon, currency exposure), then let the data guide your allocation. And please — check your home country bias. Most of us are dramatically over-invested in our domestic markets without realizing it. Diversification isn’t just a buzzword; in 2026, it’s your most practical hedge.