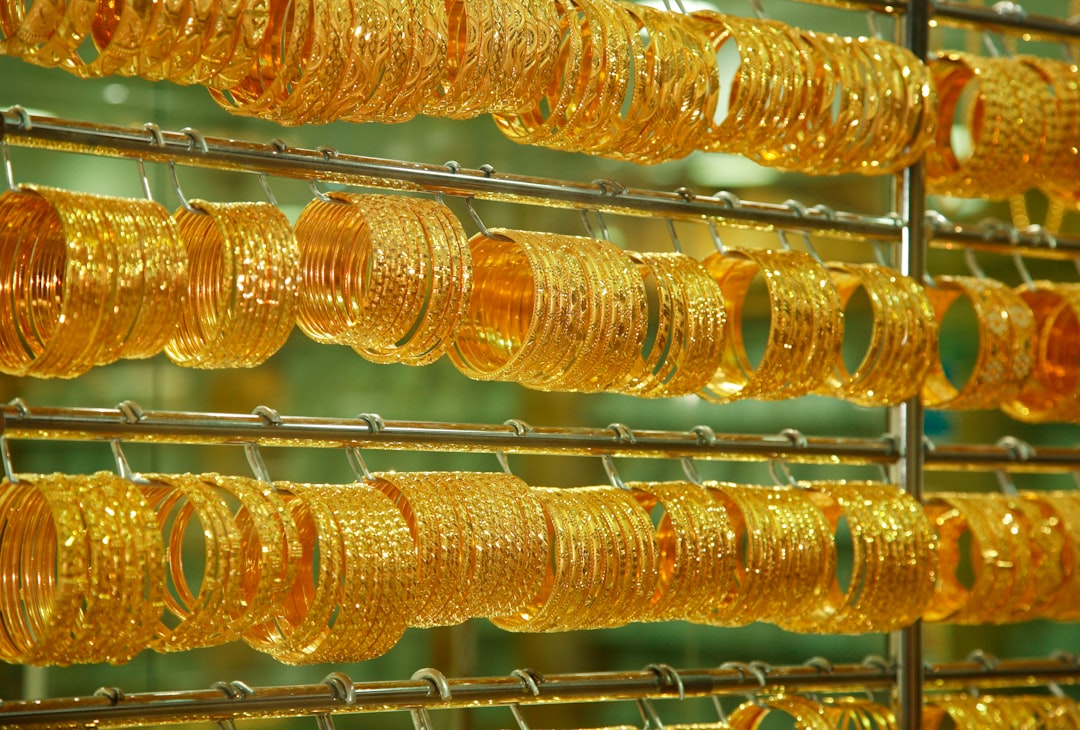
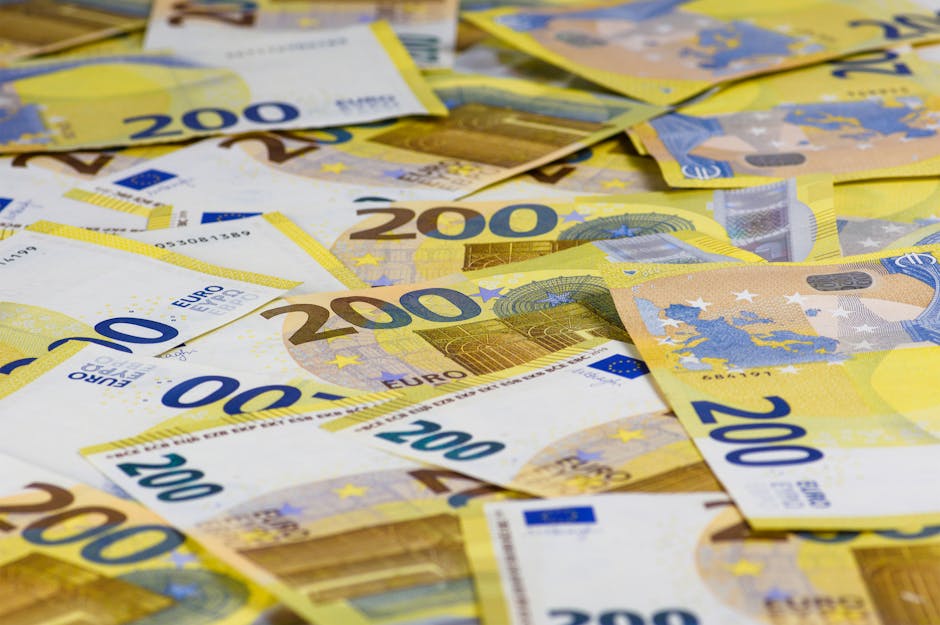
지인이 카톡을 보내왔다. “야, 금 선물 사면 진짜 금 배달돼?” 웃으면서 넘겼는데, 실제로 이걸 모르고 선물 계약 만기까지 들고 있다가 황당한 상황을 맞은 사람 이야기를 들은 적 있다. 원자재 선물 투자, 솔직히 이름만 들으면 있어 보이는데 막상 뜯어보면 함정이 한두 개가 아니다. 2026년 현재 금 선물은 온스당 4,800달러를 넘나들고 있고, 원유 WTI는 지정학 이슈로 하루 만에 ±10% 변동이 나오는 극한의 시장이다. 초보가 아무것도 모르고 들어가면? 오징어 게임 상우처럼 원금 다 날리고 시작이다. 이 글은 그 함정을 미리 보여주기 위해 썼다.
선물(Futures)의 구조는 단순하다. 미래의 특정 시점에 미리 정한 가격으로 자산을 사거나 팔겠다는 계약이다. 문제는 이 계약을 만기까지 들고 있으면 어떻게 되냐는 거다.
원유 선물 매수 포지션을 만기까지 들고 있으면, 이론적으로는 만기일에 돈을 주고 실물 원유를 받아야 한다. 구리 선물도 마찬가지다. 그럼 개인 투자자가 집에 드럼통 몇 개 받아야 하나? 물론 실제 거래소에선 현금 청산으로 처리되지만, 이 구조를 이해하지 못하면 ETF 투자 시 발생하는 ‘롤오버 비용’을 전혀 파악할 수 없게 된다.
원자재 시장은 일반 주식시장과 결정적으로 다른 점이 있다. 보관의 문제 때문에 선물거래가 압도적 주류다. 현물보다 선물 거래 규모가 훨씬 크기 때문에 가격 표기도 항상 현물과 선물 시세를 같이 공시한다. 원자재에 영향을 주는 변수가 터지면, 선물 시장에서 먼저 큰 폭의 가격 변동이 일어나고 이후 현물 시장에 파급된다는 점도 반드시 기억해야 한다.
원자재 투자 방법 4가지: 뭐가 다르고 어디서 물리는가
원자재에 투자하는 방법은 크게 4가지다. 초보일수록 뭘 선택하느냐에 따라 결과가 완전히 달라진다.
투자 방법
난이도
레버리지
주요 비용
추천 대상
핵심 리스크
원자재 선물 직접거래
⭐⭐⭐⭐⭐
최대 10~20배
거래 수수료 + 증거금
경험 있는 투자자
만기 롤오버, 마진콜
원자재 ETF (선물 기반)
⭐⭐⭐
없음(레버리지 ETF 제외)
운용보수 0.49~0.69%/년
중급 이상 초보
롤오버 손실(콘탱고)
원자재 관련 주식
⭐⭐
없음
매매 수수료
주식 경험자
원자재와 괴리 발생
실물 보유 (금 제외 사실상 불가)
⭐
없음
보관비 + 부가세
금·귀금속 투자자
유동성, 보관비용
핵심은 원자재 ETF가 실물이 아닌 선물에 투자한다는 점이다. 겉으로는 주식·채권 ETF처럼 보이지만 내부 구조가 완전히 다르다. 원자재 ETF는 선물 만기가 도달할 때마다 ‘근월물 매도 + 원월물 매수’라는 롤오버를 반복하는데, 이 과정에서 비용이 발생한다. 원자재 직접 투자와 관련 주식 투자는 서로 다른 위험-수익 특성을 나타낸다는 점도 명심해야 한다.
2026년 4월 원자재 시장 현황: 지정학 쇼크가 모든 걸 바꿨다
2026년 4월 현재 시장은 중동 상황이 완전히 뒤흔들고 있다. 호르무즈 해협 긴장이 고조되면서 WTI 원유 선물은 $86달러 부근까지 급등했고, 금 선물은 $4,800 온스 선에서 등락 중이다. 지정학적 리스크가 터지면 선물 시장에서 먼저 큰 폭의 가격 변동이 나타나는 전형적인 패턴이 2026년에도 반복되고 있다.
원자재
현재가 (2026.04.20)
1년 수익률 (대표 ETF 기준)
주요 가격 변수
리스크 레벨
금 (GC / GLD)
약 $4,800/oz
GLD 83.7% (1년)
실질금리, 달러 인덱스, 지정학
중간 🟡
원유 WTI (CL / USO)
약 $86/배럴
DBC 17.9% (1년)
OPEC 정책, 중동 분쟁, 셰일 생산
매우 높음 🔴
은 (SI / SLV)
약 $80/oz
-2.1% (최근)
산업 수요, 금 연동
높음 🟠
구리 (HG)
약 $6.06/lb
–
중국 경제, 전기차 수요
높음 🟠
우라늄 (URA)
–
129.8% (1년)
원전 확대, 에너지 안보
높음 🟠
대두 (ZS)
약 $1,178/부셸
-0.38% (최근)
기후 변화, 남미 작황
중간 🟡
2026년 원자재 시장에서 눈에 띄는 점은 금리 인하 사이클이 예상보다 더디게 진행되면서 지정학·공급 요인이 원자재 가격의 핵심 드라이버로 부상했다는 것이다. 인플레이션 헤지와 포트폴리오 다변화 수단으로 원자재 ETF가 투자자들의 핵심 도구로 귀환하고 있다는 분석도 있다.
초보가 가장 많이 물리는 함정: 롤오버(Roll-Over) 비용이란?
원자재 ETF의 숨겨진 비용, 바로 롤오버(Roll-Over)다. 선물 계약엔 만기가 있다. 만기가 월 단위로 존재하기 때문에 원자재 ETF는 지속적으로 포지션을 유지하려면 기존 만기 계약을 팔고 다음 만기 계약을 사는 과정을 반복해야 한다. 이걸 ‘근월물 매도 → 원월물 매수’라고 부른다.
문제는 콘탱고(Contango) 상황, 즉 원월물 가격이 근월물보다 높을 때다. 매번 롤오버를 할 때마다 비싼 원월물을 사고 싼 근월물을 파는 구조가 되기 때문에 원자재 가격이 제자리여도 ETF 수익률은 지속적으로 깎인다. 원유 ETF(USO)가 대표적인 피해 사례다. 선물 투자 시 롤오버 효과는 품목별로 투자 수익률에 상이한 영향을 미치기 때문에 본인이 투자하는 상품의 선물 구조를 반드시 확인해야 한다.
그래서 일부 ETF(예: COMT)는 롤 선택 방식을 최적화해 이 구조적 손실을 줄이도록 설계되어 있다. 단순히 유명한 ETF를 고르는 것보다, 롤오버 방식이 어떻게 설계되어 있는지를 따지는 게 진짜 투자자다.
절대로 하지 말아야 할 실수 7가지 (쪽박 체크리스트)
❌ 만기일 확인 안 하고 선물 직접 거래: 만기 당일 포지션 보유 중이면 현금 청산 또는 현물 인도 의무가 발생할 수 있다. 반드시 만기 전에 롤오버 또는 청산 처리해야 한다.
❌ “인플레이션이니까 원자재 다 오른다” 착각: 인플레이션이 터졌다고 모든 원자재가 오르지 않는다. 금은 실제로 헤지 역할을 했지만, 나머지 원자재는 공급망·지정학 요인이 더 크게 작용한다.
❌ 레버리지 선물 ETF를 장기 보유: 레버리지 ETF는 일간 수익률 2배를 추종하는 상품이다. 변동성 확대 시 ‘변동성 드래그(Volatility Drag)’로 원금이 빠르게 녹는다. 절대 장기 보유 수단이 아니다.
❌ 원자재 관련 주식을 원자재 직접 투자로 착각: 광산주(GDX 등)는 금 가격과 같이 움직이지 않는다. 기업의 운영 리스크, 정치적 리스크, 파이낸싱 리스크가 별도로 존재한다.
❌ 포트폴리오 전체를 단일 원자재에 집중: 원자재는 내재적 우상향성이 없는 투기적 자산으로 분류된다. 전체 포트폴리오의 5~10% 이내에서 분산 배분하는 것이 권고 수준이다.
❌ ETF 수수료(운용보수)를 무시: 원자재 ETF엔 연간 0.49~0.69%의 운용보수가 붙는다. 거기다 롤오버 비용까지 합치면 실질 비용은 체감보다 훨씬 크다. 선물 직접거래는 관리 보수가 없지만 수수료와 증거금 리스크가 따른다.
❌ 지정학 뉴스에 즉각 반응해 무지성 진입: 원자재 가격은 지정학 이슈에 과잉 반응했다가 급반전하는 경우가 빈번하다. 2026년 4월 호르무즈 이슈로 원유 하루 만에 10% 급락, 이후 재반등이 그 사례다. 뉴스 나오고 들어가면 이미 늦다.
국내외 레퍼런스: 이 사람들은 어떻게 투자하나
CME 그룹(시카고상업거래소)에 따르면 금 선물(GC) 하루 거래량은 약 2,700만 온스 수준이며, 이는 대표적인 금 ETF인 SPDR GLD의 약 30배에 달한다. 세계 최대 선물 시장은 NYMEX(뉴욕상품거래소), CME(시카고상업거래소), CBoT(시카고상품거래소), Cboe 등이며, 모두 CFTC(미국 상품선물거래위원회)의 규제를 받는다.
국내의 경우, 대부분의 원자재 상품이 선물 계약에 기초한 파생상품 ETF 형태로 거래된다. 원유 선물 ETF의 경우 복잡성과 높은 변동성을 동반하기 때문에, 입문자에게는 원유 생산 기업에 투자하는 ETF가 더 적합한 옵션으로 언급되기도 한다. 2026년 글로벌 원자재 ETF 시장에서 주목받는 상품으로는 DBC(에너지·금속·농산물 분산), GLD(금 실물 추종), URA(우라늄, 1년 수익률 129.8%), GDX(금광 주식, 1년 수익률 193.7%) 등이 있다.
FAQ: 독자들이 가장 많이 묻는 질문 3가지
Q1. 원자재 선물 ETF 사면 진짜 금이나 원유를 받게 되나요?
받지 않습니다. 원자재 ETF는 실물이 아닌 선물 계약에 투자하는 구조입니다. 만기 때마다 기존 계약을 청산하고 다음 만기의 신규 계약으로 갈아타는 롤오버를 반복하기 때문에 실물 인도가 일어나지 않습니다. 단, 금의 경우 GLD처럼 실물 금을 보관하는 현물 ETF도 존재하니 상품 설명서를 반드시 확인하세요.
Q2. 원자재 선물 투자, 전체 포트폴리오의 몇 %가 적당한가요?
글로벌 운용사들의 일반적인 가이드라인은 전체 포트폴리오의 5~10% 수준입니다. 원유·천연가스처럼 단일 원자재 ETF는 변동성이 극단적으로 크기 때문에 이보다 작은 비중이 권장됩니다. 원자재는 내재적 우상향성이 없는 투기적 성격의 자산이기 때문에 분산 헤지 목적으로 편입하는 게 원칙입니다.
Q3. 2026년 현재 가장 주목할 만한 원자재는 무엇인가요?
2026년 기준으로 금(GLD, 1년 83.7% 수익률)과 우라늄(URA, 1년 129.8% 수익률)이 두드러집니다. 금은 중동 지정학 리스크와 달러 약세 수혜를 동시에 받고 있고, 우라늄은 원전 확대·에너지 안보 테마가 강하게 작동 중입니다. 원유는 호르무즈 이슈로 단기 변동성이 극단적으로 높아진 상태라 단기 트레이딩 외엔 리스크 관리가 필수입니다.
결론: 한 줄 평과 에디터 코멘트
원자재 선물 투자는 ‘아는 만큼 돈 버는 시장’이 아니라, 모르면 확실하게 잃는 시장이다. 금은 2026년 기준으로 인플레이션 헤지 역할을 충실히 하고 있고, 우라늄은 에너지 안보 테마로 폭발적 성과를 내고 있다. 반면 원유는 지정학 변수에 따라 하루 10%가 넘는 폭락과 폭등이 반복되는 극한의 자산이다. 롤오버 비용, 만기 관리, 포지션 사이즈 조절, 분산 투자—이 4가지를 모르면 시작도 하지 말 것.
에디터 코멘트 : 원자재 선물은 ‘헷지(Hedge) 도구’가 메인이고 ‘수익 추구’는 보조 수단이다. 이 순서를 뒤집는 순간, 당신의 포트폴리오는 오징어 게임 상우의 계좌가 된다. 2026년 지금이 입문 타이밍이긴 하지만, 전체 자산의 10%를 절대 넘기지 말 것.
A colleague of mine — a mid-career finance professional who had been quietly watching his savings erode — told me something at a dinner last month that stuck with me: “I used to think keeping cash was the safe move. Now I feel like I’m bleeding out slowly every single year.” That conversation is exactly why I wanted to dig deep into the world of inflation hedge commodity investing in 2026. Because if you’re asking “what should I actually own to protect my purchasing power?” — you’re not alone, and the answer is more nuanced than most headlines suggest.
Let’s think through this together, with real data, institutional research, and a healthy dose of skepticism.
Why Commodities? The Core Inflation-Hedging Logic
Commodities are the building blocks of goods and services, so when production costs go up, commodity prices typically follow — making investing in commodities a direct way to gain exposure to inflationary trends. That’s the foundational argument, and it’s not just theory.
According to Goldman Sachs Research, commodities have demonstrated strong resilience in the face of inflation and have been a critical hedge for bonds and equities when prices and wages are climbing. Specifically, a 1 percentage point surprise increase in US inflation has, on average, led to a real return gain of 7 percentage points for commodities, while that same trigger caused stocks and bonds to decline 3 and 4 percentage points, respectively.
That’s a staggering asymmetry. And it’s exactly the kind of data-driven argument that should shape how you build your portfolio in 2026.
The 2026 Inflation Landscape: Why This Year Matters
The Peterson Institute suggests inflation could exceed 4% by the end of 2026, making scarce assets vital for wealth preservation. Meanwhile, the US enters 2026 with elevated government spending, persistent inflation pockets, and real yields that have been drifting lower. This combination — fiscal pressure plus weakening real yields — is precisely the environment where hard assets historically shine.
The effectiveness of inflation hedge investments can be influenced by various factors, including geopolitical stability, supply chain disruptions, and monetary policy — and investors must consider how these factors interact with inflation trends to make informed decisions.
Gold: Still the Undisputed King — But Read the Fine Print
Gold enters 2026 with declining real yields, elevated government spending, and structural central bank demand still intact. Major banks forecast gold prices at $4,500–$4,700, with upside toward $5,000 if macro conditions persist.
J.P. Morgan Global Research is forecasting gold prices to average $5,055/oz by the final quarter of 2026, rising toward $5,400/oz by the end of 2027. That’s a bold call, but it’s rooted in structural demand data. Central banks themselves have been major gold buyers, with purchases more than doubling since 2022 compared to pre-2020 averages — providing a firm floor under the market.
Gold and precious metals are an exception among commodities, and gold should be the preferred choice when the aim is for longer-term inflation protection. That’s not cheerleading — it’s the conclusion of long-run return studies comparing gold against energy, grains, and industrial metals over twenty-year horizons.
Silver: The Overlooked Asymmetric Play
After breaking above its resistance zone following a 120% surge in 2025, silver has entered price-discovery territory. A fifth consecutive year of structural supply deficit and accelerating industrial demand support targets beyond $65.
Silver is often used in industrial applications such as electronics and solar panels, which provides additional demand beyond its role as a store of value. This demand can contribute to price growth, particularly in times of economic expansion and inflation — making silver a solid alternative for those seeking a more affordable precious metal to hedge against inflation.
Copper and Industrial Metals: The “Green Inflation” Angle
Despite the recent rally in copper prices, Goldman Sachs notes it remains their “favorite” industrial metal, especially in the long run, as electrification — which drives nearly half of copper demand — implies structurally strong demand growth, and copper mine supply faces unique constraints.
Copper is used as a raw material in the building of homes, in electric vehicles, in cookware, in solar power collectors, and in all manner of wind energy elements, including turbines and power supply — making it a commodity to watch carefully as various industries rely on it with greater frequency.
Industrial metals may outperform precious metals in 2026 as supply deficits, infrastructure investment, and post-tariff growth support copper, aluminum, and nickel prices — with geopolitical conflict, weather-driven disruptions, and rising power demand from AI and data centers reinforcing commodities’ role in portfolios amid volatility and stagflation risk.
Energy Commodities: Handle With Care
Oil is a trickier story in 2026. Goldman Sachs forecasts Brent and WTI crude oil to decline to 2026 averages of $56 per barrel and $52 per barrel, respectively. Supply is expected to continue growing in 2026 while demand remains sluggish, expanding by less than 1 million barrels per day — meaning the oil market is likely to face a sizable surplus.
That said, energy has historically generated the strongest real returns across assets when inflation surprised to the upside, because energy usually responded both to supply and demand shocks — and while refined oil products remain the most important commodity for global consumer prices, natural gas has significant inflation hedging benefits as well.
Key Commodities to Consider for Inflation Hedging in 2026
Gold: Gold has been considered a safe-haven investment for centuries, particularly during periods of inflation. When the value of fiat currencies declines, gold tends to maintain or increase in value — because it is a tangible asset with limited supply, not directly influenced by the actions of central banks or governments.
Silver: Silver shares many of the same inflation-hedging properties as gold, but is more affordable and accessible for individual investors. While gold dominates precious metals discussions, silver can offer greater price volatility, which could lead to higher returns in a rising inflation environment.
Copper: As the demand for copper rises, especially in emerging markets and green energy projects, its price tends to increase — and during inflationary periods, copper prices often rise due to increased demand for raw materials and rising costs of production.
Natural Gas: NGI trends position natural gas as a relative winner in the commodity space for 2026. Export terminals on the Gulf Coast are running full capacity to send American gas across the ocean — a structural shift meaning domestic prices are increasingly linked to higher global benchmarks, capturing the spread between cheap US production and expensive global demand.
Agricultural Commodities: Agricultural commodities such as wheat, corn, soybeans, and coffee tend to rise in price during inflationary times, especially when supply chain disruptions or weather-related issues affect global crops — as a shortage in production, combined with rising demand, often leads to higher prices.
Platinum: China is seeing a resurgence in platinum jewelry demand, and beyond jewelry, platinum is crucial for the hydrogen economy and catalytic converters in hybrid vehicles — meaning as the world hedges between pure EVs and hybrids, platinum demand finds new support.
Commodity ETFs (e.g., DBC, PDBC, XME): You can invest in commodities through ETFs like $DBC (broad commodity exposure) or $PDBC (actively managed), which track prices of energy, metals, and agriculture without requiring futures contracts. For more targeted exposure, consider sector-specific ETFs or stocks of commodity-producing companies.
International Case Studies & Institutional Positioning
The Bloomberg Commodity Index (BCOM) total return has risen 11% annualized so far in the 2020s — a compelling track record that has drawn institutional attention globally. In South Korea, major pension funds including the National Pension Service (NPS) have incrementally raised their alternative asset allocation, with commodities and real assets forming a growing slice. Globally, sovereign wealth funds from Norway to Singapore have used commodity futures and gold allocations as structural inflation buffers.
The SPDR S&P Metals & Mining ETF (XME) gained 13% during the highly inflationary environment of 2022, versus a negative 18% total return for the S&P 500 — a real-world demonstration of how commodity exposure can act as a portfolio shock absorber.
Central banks themselves have been major gold buyers, with purchases more than doubling since 2022 compared to pre-2020 averages. This isn’t retail speculation — it’s institutional-level conviction in hard asset preservation.
The Honest Caveats: What the Data Also Tells Us
Here’s where I’ll push back on the simple “just buy commodities” narrative — because the data deserves honesty.
To broadly state that commodities are great inflation hedges is not entirely correct. Over the long term, many commodities do not broadly hold up against inflation. Not all commodities are good inflation hedges — in fact, over the past twenty years, gold and precious metals appear to be the only commodities that have done an admirable job protecting purchasing power and increasing in real value.
The effectiveness of any hedge depends on horizon and regime. Over twelve-month horizons some assets react to an inflation surprise, while over multi-year horizons those relationships can weaken or reverse as policy and the macroeconomy adjust. No single asset class provides a permanent hedge against unexpected inflation.
Risks include market volatility, liquidity risks, and regulatory changes that can impact the effectiveness and performance of inflation hedge investments. Commodities can be brutally cyclical — they move in defined cycles and are not buy-and-hold forever investments. Within a short period of time, commodities surge higher then subsequently crash back down.
Practical Strategies: Building Your 2026 Inflation-Hedge Commodity Portfolio
When it comes to hedging against inflation, diversification is key, but it’s how you diversify that counts. Assets that may strengthen your portfolio in the face of inflation include utility stocks and real estate as well as copper and gold.
A balanced approach might include:
A core gold allocation (physical, ETF, or gold-backed accounts) as a long-term anchor
Silver for upside asymmetry in the current supply-deficit cycle
Copper via ETFs or mining stocks for green-energy demand exposure
A small allocation to broad commodity ETFs (DBC/PDBC) for diversified inflation sensitivity
For the fixed-income side, consider inflation-linked securities — instruments that link cash flows to a consumer price index, such as Treasury Inflation-Protected Securities (TIPS) and their equivalents elsewhere — government bonds that index principal and coupon payments to the consumer-price index.
If your goal is to build an inflation-resistant portfolio, you don’t have to invest only in commodities. But by incorporating them into a diversified investment strategy, you can prepare your portfolio to not only weather the effects of inflation but also come out even stronger on the other side.
Editor’s Comment : The biggest mistake I see investors make in 2026 is treating commodity investing as an all-or-nothing bet. You don’t have to go full “gold bug” or bet the ranch on oil futures to benefit from inflation protection. Think of commodities as the immune system of your portfolio — not the main engine. Start with gold as a stable anchor (even a 5–10% allocation has historically made a measurable difference), layer in copper for the green energy megatrend, and use broad commodity ETFs to smooth the volatility. And crucially: revisit your allocation every quarter. In a world where geopolitical shocks can move commodity markets 10% in a week, the investor who adjusts thoughtfully will always outperform the one who set-and-forgot.
지인이 카톡을 보내왔다. “야, 요즘 물가 미쳤잖아. 예금 넣어봤자 다 녹는 거 아니야? 뭐 사야 해?” 솔직히 말하면, 그 친구한테 바로 답장 못 했다. 15년 동안 원자재 시장 들여다보면서도 2026년 이 상황은 진짜 ‘레벨이 다르다’는 걸 느끼기 때문이다.
OECD가 2026년 4월 보고서에서 미국 인플레이션을 4.2%로 전망했다. 연준이 2.7%라고 우기는 동안, 이란 전쟁발 에너지 충격과 트럼프 관세가 실물 경제를 두드려 패고 있다. 이 상황에서 예금? 채권? 웃기는 소리다. 지금 당장 ‘실물(實物)’을 담아야 한다.
이 글은 그 친구한테 보내려고 쓴 글이다. 뜬구름 잡는 거 없이, 2026년 현재 데이터 기준, 인플레이션 헤지에 쓸 수 있는 원자재 TOP 4를 냉정하게 해부한다.
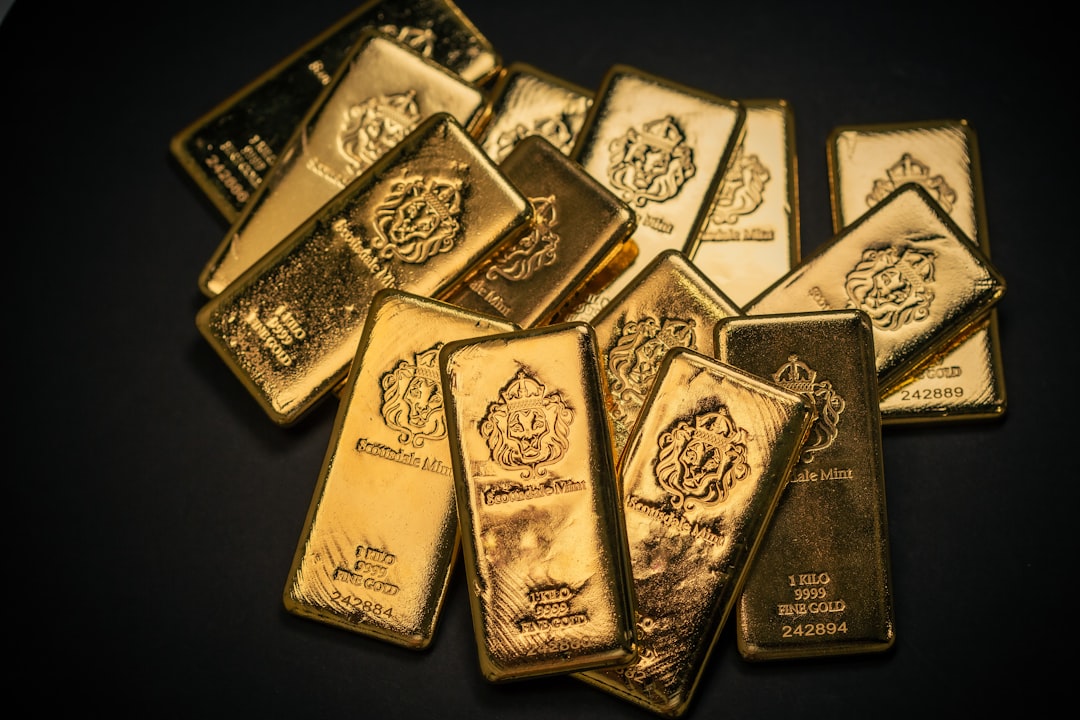
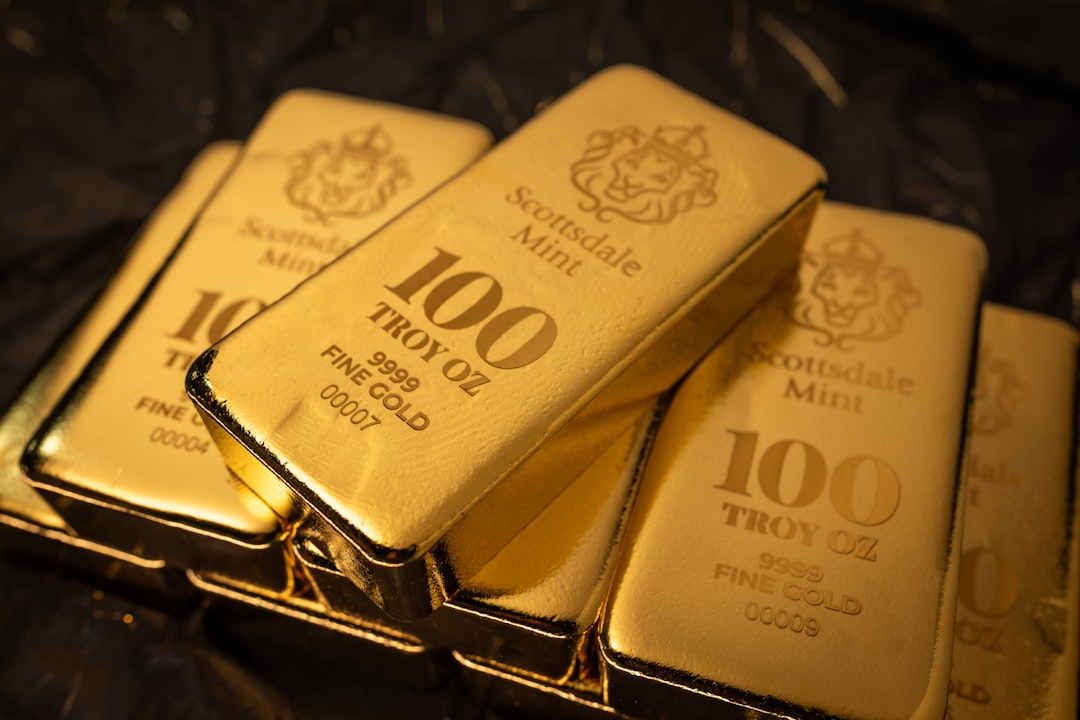
📌 1. 금(Gold) – 공포와 탐욕 사이, 온스당 5,600달러의 현실
📌 2. 은(Silver) – 연간 130% 폭등, 아직도 늦지 않았나?
📌 3. 구리(Copper) – AI·전력망이 만든 ’22년 만에 최대 공급 적자’
📌 4. 원유(WTI) – 헤지 수단인가, 폭탄인가? 직접 써본 결론
📌 5. 원자재별 비교표 한눈에 보기
📌 6. 절대 하지 말아야 할 원자재 투자 실수 7가지
📌 7. FAQ: 독자들이 가장 많이 물어보는 것들
1. 금(Gold) – 온스당 5,600달러, 이미 늦은 건 아닐까?
결론부터 말한다. 안 늦었다. 구조가 바뀌었기 때문이다.
2025년 한 해 동안 금값은 65% 이상 급등하며 사상 최고치를 53차례나 경신했고, 2026년 1월 말에는 온스당 5,600달러라는 전례 없는 기록을 달성했다. 그리고 지금도 멈추지 않고 있다.
왜 이게 단순한 ‘투기 버블’이 아닌가? 현재 글로벌 경제의 시대정신은 ‘리플레이션(Reflation)’이다. 정부는 재정을 풀고 부채를 늘려서라도 성장을 유도하고, 중앙은행은 인플레이션을 어느 정도 용인하면서 금리를 낮게 유지하려 한다. 이런 환경에서 금은 그냥 빛나는 돌이 아니다.
매수 주체도 달라졌다. 러시아 자산 동결 사태 이후, 인도와 중국 등 비서방 국가들이 달러 대신 금을 쓸어 담고 있다. 중국은 금 보유량을 14개월 연속 늘리고 있으며, 2025년 동안 금 ETF로의 대규모 자금 유입이 발생했다.
주요 IB들의 2026년 금 목표가를 보면: 주요 은행들의 평균 2026년 금 전망가는 온스당 4,500~4,700달러에 집중되어 있으며, 거시적 여건이 완화되지 않을 경우 상단은 5,000달러까지 열려 있다. Bank of America는 미 연준의 금리 완화 정책과 재정 건전성 우려가 결합되어 2026년 중반 온스당 5,000달러 피크를 찍을 것으로 전망한다.
하지만 리스크도 있다. 2026년으로 향하면서 핵심 리스크는 예상치 못한 매파적 연준이다. 실질 금리의 급격한 상승은 역사적으로 금의 모멘텀을 꺾어왔다. 금이라고 무조건 사면 된다고 생각하면 그건 초보자다.
투자 방법: KRX 금현물 ETF(ACE KRX금현물, TIGER 금현물), 금 채굴주 ETF(HANARO 글로벌금채굴기업), 미국 GLD, IAU, GDX
2. 은(Silver) – 연간 130% 폭등한 ‘잊혀진 자산’의 귀환
은(Silver)은 한동안 금의 ‘저가판’으로 취급받았다. 그런데 2025~2026년 판도가 완전히 달라졌다.
금은 사상 최고치를 계속 경신하며 2025년 한 해 65% 상승했고, 은은 무려 130%, 플래티늄도 120% 상승하는 등 모든 귀금속이 엄청난 상승을 보이면서 시장을 주도하였다.
은은 2026년을 완전히 다른 에너지로 맞이하고 있다. 2025년 말에 온스당 55달러를 돌파하며 50~54달러 구간을 확실한 지지선으로 굳혔고, ‘잊혀진 자산’에서 원자재 시장에서 가장 강력한 스토리 중 하나로 올라섰다. 연초 대비 상승률이 약 120%에 달한다.
은의 진짜 무기는 ‘이중 수요’다. 은은 전자기기와 태양광 패널 등 산업 응용 분야에서 널리 사용되어 가치 저장 수단 역할 외에도 추가적인 수요가 발생한다. 이 수요는 경제 팽창과 인플레이션 시기에 가격 상승에 기여하며, 결과적으로 은은 인플레이션 헤지를 위한 더 저렴한 귀금속 대안으로 기능한다.
태양광 패널 효율을 높이기 위해 은 함량이 늘어나고 있으며, 중국은 2026년부터 은 수출 허가제를 도입하여 자원을 무기화하려 한다. 공급이 막히면 가격이 어떻게 될지는 수요공급 기초만 알아도 안다.
은값은 지정학적 환경의 역풍에 단기 조정을 유발하며 82달러까지 하락했지만, 달러 약세 전환·금-은 비율이 60 이하로 하회·COMEX에서 은 선물의 백워데이션이 나타난다면 100달러 돌파 가능성은 여전히 유효하다.
투자 방법: KODEX은선물H, SLV(미국 ETF), PSLV(실물 은 ETF), 은 채굴주 ETF(SIL)
3. 구리(Copper) – AI가 만들어낸 22년 만에 최대 공급 적자
구리는 ‘닥터 코퍼(Dr. Copper)’라고 불린다. 경기 선행지표로 기능한다는 뜻이다. 그런데 2026년 구리는 그 이상이다. 인플레이션 헤지이자, AI 인프라 투자 수혜주이자, 에너지 전환의 핵심 소재다.
주요 은행들은 2026년 구리 시장이 22년 만에 최대 공급 적자를 기록할 것으로 전망하고 있다.
구리는 AI 데이터센터와 전력망 확충의 핵심 소재다. 엔비디아의 새로운 칩들이 고압 직류 전송을 요구하면서 구리 전선 수요는 폭발적으로 늘어나는데, 광산 공급은 턱없이 부족하다.
데이터센터 자체의 구리 직접 소비는 제한적이지만, 대규모 전력을 안정적으로 공급하기 위한 초고압 송전 설비에 구리가 대거 투입된다는 점에서 간접 수요가 상당하다는 분석이다.
수급 구조도 선명하다. 도이체방크는 2026년 말 구리 가격이 톤당 10,000달러를 초과할 가능성을 보고 있으며, 시장이 ‘구조적 공급 적자’ 국면으로 진입 중이라고 분석한다. 이는 투자 부진과 광산 공급의 비탄력성 때문이다.
알루미늄도 곁들여 볼 만하다. 전기전도율과 열전도율은 구리보다 낮지만, 구리 1톤을 2.5톤 비율로 대체할 수 있어 구리 가격 급등 시 대안으로 기능한다. 구리가 너무 비싸지면 알루미늄 수요가 따라 올라온다는 뜻이다.
투자 방법: COPX(글로벌 구리 채굴주 ETF), CPER(구리 선물 ETF), FCX(Freeport-McMoRan 주식), JJC
4. 원유(WTI) – 헤지 수단인가, 폭탄인가? 직접 써본 결론
원유는 가장 직접적인 인플레이션 연동 자산이다. 그러면서 동시에 가장 위험한 자산이기도 하다. 이 둘을 구분하지 못하면 쪽박이다.
원유는 글로벌 경제 활동의 근간이다. 가격이 오르면 휘발유, 경유, 항공유 비용이 즉각 상승하고, 이 높아진 운송·제조 비용이 소비자에게 전가되어 경제 전반의 물가를 끌어올린다. 즉, 원유는 인플레이션을 ‘반영’하는 게 아니라 ‘만들어내는’ 자산이다.
금이 주로 공포를 헤지하는 자산으로 금융 불안정이나 시스템 신뢰 상실 시 빛을 발한다면, 원유는 성장과 비용 상승을 헤지하는 자산이다.
하지만 2026년 원유는 복잡하다. 원유 가격은 2026년에도 낮은 수준에서 유지될 것으로 예상된다. OPEC 국가들의 생산량이 늘어나고 있고, 미국이 러시아산 원유에 대해 전면 제재를 가하지 않는다면 국제시장에서 원유 공급이 과잉될 가능성이 높다. 반면, 호르무즈 봉쇄 등 지정학적 리스크는 단기 급등 요인이 된다.
원유가 너무 많이 오르면 수요 자체를 죽여 결국 자신의 트렌드를 스스로 뒤집는 부작용도 있다. 이걸 모르고 원유 ETF 풀매수했다가 허리 부러진 사람 주변에 한두 명씩은 있다.
투자 방법: USO(WTI 원유 ETF), BNO(브렌트유 ETF), XLE(에너지섹터 ETF), 에너지 주식 XOM(ExxonMobil)
5. 원자재 비교표: 2026년 인플레이션 헤지 성능 한눈에 보기
원자재
2025년 수익률
2026년 전망가
인플레이션 헤지 강도
변동성
대표 ETF (한국/미국)
적합 투자자
🥇 금(Gold)
+65%
$4,500~$6,000/oz
★★★★☆
중간
ACE KRX금현물 / GLD
안전자산 선호 장기투자자
🥈 은(Silver)
+130%
$82~$100+/oz
★★★★★
높음
KODEX은선물H / SLV
고수익 추구, 산업 수요 이해자
🔴 구리(Copper)
+36%
$10,000+/톤
★★★★☆
높음
미출시 / COPX, CPER
AI·에너지 전환 테마 투자자
🛢️ 원유(WTI)
-22%
공급과잉 우려, 지정학 변수
★★★☆☆
매우 높음
TIGER원유선물H / USO
단기 트레이더, 지정학 분석 가능자
※ 수익률은 CME Group 데이터 기준 2025년 연간 성과. 전망가는 주요 IB 컨센서스 기준이며 실제 결과와 다를 수 있음.
6. 이거 모르면 원자재 투자로 절대 돈 못 번다: 실수 7가지
❌ 선물 ETF인 줄 모르고 장기 보유 – USO, KODEX원유선물 등 선물 기반 ETF는 롤오버 비용이 발생한다. 수익률이 현물과 다르다. 장기 보유할 생각이면 현물 또는 현물 기반 ETF로 가야 한다.
❌ 원자재 100% 풀매수 – 원자재와 금 모두 장기적으로 위험 대비 수익률이 특별히 높지 않다. 대부분의 장기 투자자는 포트폴리오에서 소규모 비중으로 제한하는 것이 바람직하다. 포트폴리오의 5~15%가 적정선이다.
❌ 금 = 인플레이션 헤지라는 맹신 – 금은 인플레이션 헤지로서 혼재된 기록을 가지고 있으며, 원자재 전반이 더 신뢰할 수 있는 헤지 수단이다. 금은 ‘공포 헤지’에 더 가깝다.
❌ 원유 단기 급등에 올라타기 – 지정학 이슈로 원유 급등할 때 따라 들어가면 뒤통수 맞는다. 원유는 완벽한 헤지 수단이 아니다. 조정 속도도 빠르다.
❌ 환헤지 여부 확인 안 하기 – 원자재 ETF 이름에 ‘H’가 붙어 있으면 환헤지, 없으면 환노출이다. 달러 강세/약세 방향에 따라 수익률이 완전히 달라진다.
❌ 공급 사이클 무시하기 – 원자재 전반에서 설비 투자(Capex)는 2012~2014년에 정점을 찍고 줄어들어 현재까지 그 수준을 하회하고 있다. 공급이 안 느는 상황에서 수요만 보면 반쪽짜리 분석이다.
❌ 운용보수(TER) 확인 안 하기 – 원자재 ETF의 운용보수 비율은 높은 편이며, CPER은 0.8%로 가장 높은 편에 속한다. 장기 보유 시 복리로 갉아먹는 비용이 무시 못 할 규모가 된다.
FAQ: 독자들이 댓글로 꼭 물어보는 것들
Q1. 금, 은, 구리 중에 지금 당장 하나만 골라야 한다면 뭘 사야 하나요?
지금 시점에서 ‘안정성’을 원한다면 금, ‘공격적 수익률’을 원한다면 은, ’10년 장기 테마’에 배팅하고 싶다면 구리를 선택하라. 셋 다 사는 게 정답이지만, 하나만 고르라면 나는 지금 은을 고른다. 은과 구리는 ‘AI와 에너지 전환의 필수재’라는 점에서 금과 다르다. 화폐적 성격과 산업적 수요를 동시에 가진 은은 2026년 가장 비대칭적인 수익 구조를 갖고 있다.
Q2. 원자재 ETF 말고 현물(실물)로 사는 게 나을까요?
금·은 소량이라면 실물도 의미 있다. 하지만 보관료, 매매 스프레드, 진위 감정 비용이 생각보다 크다. 구리나 원유는 실물 보관 자체가 개인에겐 비현실적이다. 대부분의 경우 현물 기반 ETF(KRX 금현물, PSLV 등)가 실용적인 선택이다. 2024년부터 2026년 초까지 금 가격은 신고점을 경신했으며, 신흥국 중앙은행의 대규모 매수와 기록적인 투자 수요가 이를 이끌었다. 이 흐름에 올라타는 가장 쉬운 방법이 ETF다.
Q3. 인플레이션이 잡히면 원자재도 다 떨어지나요?
꼭 그렇지는 않다. 2026년에는 산업금속이 귀금속을 능가할 수도 있는데, 공급 적자와 인프라 투자, 관세 소화 이후 경기 회복이 구리·알루미늄·니켈 가격을 지지하기 때문이다. 지정학적 갈등, 날씨 관련 공급 차질, AI와 데이터센터의 전력 수요 급증이 원자재의 포트폴리오 내 역할을 강화한다. 인플레이션 데이터 하나만 보고 원자재 전체를 팔면 손해 보는 경우가 생긴다.
결론: 2026년 원자재 투자, 한 줄 평
금 ★★★★☆: 안정적인 헤지, 지금 들어가도 늦지 않지만 단기 급등은 기대 말 것. 은 ★★★★★: 이미 많이 올랐지만 구조적 수요가 뒷받침. 변동성 감당 가능하면 최선의 선택. 구리 ★★★★☆: AI 시대의 원자재 왕. 10년 장기 투자자라면 지금이 적기. 원유 ★★☆☆☆: 단기 트레이더 아니면 손대지 마라. 지정학 리스크는 양날의 검이다.
에디터 코멘트 : 15년 동안 시장 보면서 느낀 건 하나다. 인플레이션이 진짜 심각해지면, 현금과 채권은 조용히 녹는다. 소리도 없이. 2026년 지금이 바로 그 순간이다. 포트폴리오 한 귀퉁이라도 실물 자산을 담아두지 않은 사람은 1년 뒤 후회할 가능성이 높다. 단, ‘묻어두기’가 아니라 사이클을 읽고 리밸런싱하는 사람만 진짜 돈을 번다는 것도 잊지 마라.
A few months back, I was catching up with a friend who manages a small but internationally-diversified bond portfolio. He’d just returned from a conference in Singapore and looked a little pale. “I keep hearing the same thing in every room,” he said, swirling his coffee. “Everyone agrees the next crack won’t come from Wall Street — it’ll come from the periphery. Again.” That conversation stuck with me. And the more I dug into the data over the following weeks, the more I realized: 2026 is genuinely a year worth paying very close attention to for emerging markets.
So let’s dig in together. Not to cause panic, but to think clearly about what the numbers actually tell us — and what you should be watching.
📊 The Big Picture: Where Emerging Markets Actually Stand in 2026
First, the headline that might surprise you: it’s not all doom and gloom. Growth projections indicate emerging markets will reach 3.9% in 2026, up from 3.7% in 2025 — though Southeast Asia and Middle East expansion contrasts sharply with subdued Latin America and Eastern Europe performance. That divergence alone tells you a lot. “Emerging markets” is not a monolithic bloc, and treating it as one is the classic investor mistake of 2026.
The World Bank adds important nuance here. Emerging market and developing economy (EMDE) regions proved more resilient to last year’s trade tensions than expected, with trade supported by the temporary front-loading of exports and domestic demand underpinned by easier global financial conditions. Nevertheless, prospects over 2026–27 are uneven across regions and remain generally subdued amid a less favorable global trade environment.
And critically, risks to the outlook remain tilted to the downside, including those from renewed trade frictions and policy uncertainty, tighter global financial conditions, elevated fiscal vulnerabilities, rising geopolitical tensions and conflict, and climate- and public-health-related shocks. That’s essentially a full checklist of stress triggers — and several are already flashing amber.
⚠️ The Real Fault Lines: Capital Flows, Currency Risk & the Nonbank Problem
Here’s where things get technically interesting — and dangerous. The IMF’s April 2026 Global Financial Stability Report zeroes in on a structural shift that flew under the radar for years. This trend delivers important benefits but also poses new risks — notably greater vulnerability to a sudden reversal in capital flows when global shocks occur.
Think of it this way: the shift from bank-based financing to nonbank, market-based financing means the old stabilizers are gone. Portfolio flows to emerging markets tend to be more volatile than bank flows and are increasingly sensitive to global risk conditions. Abrupt retrenchments can intensify external financing pressures, raise borrowing costs, and trigger sharp currency depreciations, leading to financial strains that weigh on economic growth.
Investment funds create a specific doom-loop mechanism. Investment funds, which account for the bulk of portfolio investments in emerging markets, can be exposed to sudden redemption pressures, forcing them to sell assets quickly. Benchmark-driven strategies, such as those used by passive funds and most exchange-traded funds, automatically adjust portfolios when index weights change, increasing the risk of synchronized asset sales. This is exactly what gives seasoned risk managers nightmares.
🌍 The Core vs. Periphery Split: Who’s Actually at Risk?
The Federal Reserve Bank of New York published a sharp piece in April 2026 that crystallizes the divide we need to understand. The numbers are stark: the median sovereign spread across Periphery EMs has increased by 45 bps from February 27 to 332 bps, whereas the median spread on Core EM debt has increased by only 4 bps over the same period.
That 45 bps vs. 4 bps gap is not noise — it’s a structural signal. Why the difference? The improved resilience of Core EM economies reflects the sustained period of macroeconomic and institutional reform that began after the crises of the 1990s. At that time, many governments faced high exposure to foreign currency liabilities, limited foreign exchange reserves, and weak monetary policy frameworks, leaving them vulnerable to capital flow reversals. Over subsequent decades, Core EMs implemented reforms aimed at reducing these vulnerabilities and strengthening policy credibility.
In contrast, the periphery remains trapped. Many Periphery economies still borrow predominantly in foreign currencies, hold lower levels of foreign exchange reserve buffers, and have central banks that investors view as less credible. When global risk appetite shifts, capital outflows from emerging markets typically lead to currency depreciations. In economies with significant reliance on foreign currency borrowing, this depreciation tightens financial conditions by straining government and private-sector balance sheets and raising debt servicing costs.
💸 The Debt Maturity Time Bomb
The OECD’s Global Debt Report flags something you won’t hear much about in mainstream financial media. Around 20% of the USD-denominated debt issued by EMDEs will mature by 2027, with high-risk countries facing a slightly higher share, exceeding 25%. And the refinancing environment is punishing: for non-investment grade countries, secondary market yields on maturing debt often exceed 10%, and their averages are higher than the average rates of the maturing debt in all three years (2025, 2026 and 2027). Thus, countries refinancing this debt in the market will likely face a significant rise in borrowing costs, straining public finances over the life of the new bonds.
Specific countries are caught in the crossfire. Twenty-four EMDEs will see more than half of their outstanding bond debt mature by 2027. Fifteen of these countries had a credit rating corresponding to high-risk or lower at the end of 2024. This group includes nine countries with debt-to-GDP ratios above 60%: Argentina, Brazil, Grenada, Guinea-Bissau, Lao PDR, Namibia, Pakistan, Togo and Yemen.
🔍 Country-Level Case Studies: India, Mexico, Turkey, and Argentina
Let’s go beyond the aggregate data and look at specific cases — this is where the real investment insight lives.
India is the standout story. India is the clearest test case, and its current strategy preserves optionality across systems. Its domestic capital market development and geopolitical non-alignment give it a buffer most peers lack. Tax cuts in India may increase deficits in the near term, but regulatory and labor reforms are expected to make up for lost tax revenue by boosting economic output.
Mexico is a more complicated picture. Mexico both benefits materially from nearshoring under the US-Mexico-Canada Agreement and has deep capital markets. Yet its structural dependence on North American supply chains limits its ability to pivot if political or trade conditions deteriorate.
Turkey and Argentina represent the reform-in-progress stories. Turkey already achieved a double-digit inflation decline in 2025 and will likely continue this trend, allowing for further central bank rate cuts. Argentina has also engineered a sizable drop in inflation that we expect to continue, enabling rate cuts in 2026. Real progress — but both remain vulnerable to sentiment shocks.
Vietnam and Korea face tariff headwinds directly. Other Asian countries face elevated US tariffs, the impact of which will hit harder in those for which US exports are a substantial contributor to GDP, such as Vietnam and Korea, while others, like India and Indonesia, are less vulnerable.
📋 Key Risk Factors to Watch in 2026 — The Checklist Every Investor Needs
Capital Flow Reversal Risk: A spike in the VIX or a global risk-off event can trigger nearly instantaneous portfolio outflows from EM bonds — a one-standard-deviation VIX increase is associated with portfolio debt outflows from emerging markets of about 1% of quarterly GDP on average.
Debt Rollover Pressure: Declining foreign exchange reserves, widening current account deficits, clustered external debt maturities, and rising exchange rate pass-through risks can rapidly transform a global slowdown into a domestic recession.
Fiscal Space Compression: Public debt ratios across emerging markets are materially higher than in the early 2010s, compressing fiscal space and increasing the cost of policy error.
Nonbank Financing Fragility: Post-2008 regulatory reforms that constrained the risk-taking capacity of global banks have pushed riskier borrowers toward nonbank financing, resulting in reduced sensitivity of bank-based financing to global risk, and increased sensitivity for market-based nonbank financing.
Geopolitical Contagion: These risks have come to the fore in the context of the war in the Middle East, as several emerging markets are experiencing a reversal of capital flows from nonresident nonbank investors.
Trade Policy Uncertainty: About six in ten respondents point to changes in trade policy — including tariffs — as one of the greatest risks to global growth, with geopolitical instability or conflicts cited second most often.
Institutional Architecture Fragmentation: The global financial system now operates within a fragmented institutional architecture, characterized by overlapping legal jurisdictions, competing settlement systems, closer alignment between finance and industrial policy, and the growing use of sanctions.
🛡️ The Silver Lining: Why This Isn’t 1997 (But Vigilance Still Matters)
Here’s the important counterpoint — and I mean it sincerely. The structural resilience of core EMs has genuinely improved. Credit profiles for EM governments are on an upward trajectory, with positive rating changes far exceeding negative ones in 2025 at a ratio of roughly 2:1, a pattern fueled by steady improvements in fiscal health while many advanced economies grapple with rising borrowing costs.
Corporate balance sheets look healthier too. Corporate net leverage remains low, with the average EM company running at around 1.2x leverage, lower than developed counterparts and representing a 0.6x improvement from levels a decade ago, while also offering superior spread compensation per turn of leverage.
And a key structural buffer has developed: the investor base of these markets has evolved, with greater involvement by domestic players reducing reliance on overseas capital and bolstering resilience across market cycles.
Policy tools have also improved. A combination of measures — including monetary policy and exchange rate flexibility, complemented where appropriate by foreign exchange intervention — and macroprudential tools can help contain vulnerabilities and protect against potential risks.
📌 Realistic Alternatives & Investment Strategy for 2026
If you’re an investor or simply someone tracking global macro, the message isn’t “get out of emerging markets.” The message is get selective. Here’s the framework that makes sense right now:
Favor Core over Periphery: Stick with countries that have developed local currency bond markets, adequate FX reserves, and credible central banks. India, Indonesia, and Brazil (with caveats) fit this profile better than frontier markets.
Watch the VIX and USD closely: A sustained VIX spike or dollar surge is your early warning signal for EM stress. Both can move fast. Have a plan before they move.
Prefer local-currency EM bonds where real yields are compelling: Local-currency EM bonds are particularly attractive. EM central banks have been slow to cut rates, leading to elevated real yields that are among the most compelling in years.
Understand individual country debt maturity profiles: Nations with large USD-denominated debt walls maturing in 2026–2027 face the sharpest refinancing risk — Pakistan and Egypt deserve close monitoring.
Don’t mistake macro resilience for immunity: Even moderate shocks now have the potential to propagate rapidly across financial, fiscal, and real economy channels. In this environment, the risk of recession is less about cyclical overheating and more about structural vulnerability.
The bottom line on 2026 is this: a full-blown systemic emerging market crisis like 1997–98 is not the base case, but the ingredients for localized, severe crises in Periphery EMs are very much in place. The IMF’s April 2026 World Economic Outlook, titled “Fiscal Policy under Pressure: High Debt, Rising Risks,” says everything you need to know in its title alone.
For central banks and finance ministries, the challenge in 2026 is not precise forecasting. Instead, it is the timely detection of regime shifts and the rapid deployment of credible policy responses before negative feedback loops become self-reinforcing. That advice applies to investors too.
Editor’s Comment : Having tracked emerging market cycles for over a decade, the pattern that worries me most in 2026 isn’t any single data point — it’s the convergence. Geopolitical stress, nonbank fragility, debt maturity walls, and institutional fragmentation are all peaking at once. That’s not a prediction of disaster; it’s a call for precision. The investors who thrive this year won’t be the ones who fled EM entirely — they’ll be the ones who knew exactly which emerging markets to hold, and why. Do your country-level homework. The aggregate numbers will lie to you.
지난달 지인 중 한 명이 전화로 물어왔다. “형, 나 신흥국 채권 ETF 좀 샀는데 괜찮아요?” 그 친구, 뉴스 보다가 ‘신흥국 호황’ 기사 보고 덥석 물었단다. 근데 솔직히 말해줬다. “지금 분위기가 좋아 보이는 거랑, 진짜 안전한 거랑은 완전 다른 얘기야.”
2026년 신흥국 경제, 표면적으로는 성장 중이다. 인도가 6%대 질주, 아세안도 4%대 유지. 근데 그 밑에 뭐가 깔려 있는지 아는 사람이 별로 없다. 달러 부채 폭탄, 비은행 자본 쏠림, 관세 충격, 지정학 리스크…. 오늘 이걸 다 까발린다. 끝까지 읽어야 손해 안 본다.
KIEP(대외경제정책연구원)는 2026년 세계경제 성장률을 3.0%로 전망하면서, 핵심 키워드로 ‘완충된 둔화, 비대칭의 시대(Buffered Slowdown amid an Asymmetric World)’를 제시했다. 그 안에서 신흥국은 어떤가?
신흥국은 대외 불확실성 속에서도 견고한 내수에 힘입어 성장세를 유지하는 나라와, 구조적 제약으로 둔화되는 나라 간 성장 차별화가 뚜렷해질 전망이다. 평균치가 좋아 보인다고 다 같이 잘 크는 게 아니라는 소리다. 인도·베트남은 날고, 일부 아프리카·남미 국가들은 조용히 침몰 중이다.
현대경제연구원에 따르면 중국 성장세 약화가 다른 주요 신흥국 및 개도국 성장 효과를 상쇄해 2026년 신흥국 및 개도국 경제성장률(4.0%)은 2025년(4.1%)보다 소폭 둔화될 것으로 예상된다.
신흥국에서 구조적 리스크로 작용할 수 있는 부채 이슈가 상존하는 가운데, 2026년 원자재 가격 흐름이 전반적으로 하락할 것으로 예상되는데, 이는 원자재 수출이 많은 신흥국에는 바람직하지 않은 환경으로 다가온다. 즉, 성장률 평균 4%라는 숫자가 실제론 ‘부익부 빈익빈’의 가면을 쓰고 있다는 거다.
🔥 2026 신흥국 위기 시나리오 3가지
시나리오 1. 달러 강세 + 금리 역습
국가 부채 부담은 신흥국에 훨씬 더 치명적인 제약으로 작용할 수 있다. 신흥국은 선진국에 비해 금융시장의 신뢰 기반이 취약하고, 자국 통화의 국제적 위상이 낮아 외화로 표시된 부채 비중이 높은 경우가 많다. 이로 인해 글로벌 금리가 상승하거나 달러 강세가 나타날 경우, 이자 부담과 원리금 상환 압력이 급격히 확대된다.
미국 경제가 급격히 둔화되는 ‘하드 랜딩’ 시나리오에서는 신흥국 성장과 달러 대비 통화가치에 큰 타격을 주어 현지통화 채권 수익률에도 영향을 미친다. 반대로 미국이 과열되면?
또 다른 꼬리 리스크는 미국 경제가 과열되어 인플레이션이 목표치를 상회하고 연준이 긴축 편향을 지속하는 경우다. 이 시나리오에서는 달러 강세가 뚜렷해지고 연준이 심지어 금리를 인상할 수도 있다.
시나리오 2. 비은행 자본의 갑작스러운 이탈
글로벌 금융위기 이후 신흥국으로의 포트폴리오 자금 흐름은 8배 증가해 누적 기준 약 4조 달러에 달했다. 포트폴리오 부채는 현재 신흥국 GDP의 평균 약 15%로, 2006년 약 9%에서 상승했다. 이 자본의 80%는 투자펀드·헤지펀드·연기금·보험사 등 비은행 기관이 제공하고 있으며, 이는 20년 전의 두 배 수준이다.
포트폴리오 자금 흐름은 은행 대출보다 변동성이 크고 글로벌 리스크 상황에 더욱 민감하다. 갑작스러운 이탈은 외부 자금 조달 압력을 심화시키고, 차입 비용을 높이며, 급격한 통화 가치 하락을 초래해 경제 성장에 악영향을 미치는 금융 압박으로 이어질 수 있다.
실제로 VIX(공포지수)가 1표준편차만 올라도 어떤 일이 벌어지냐고?
이는 2022년 초 연준 금리 인상 당시 VIX 급등과 유사한 수준으로, 이 정도의 상승은 신흥국 포트폴리오 부채 자금 유출과 평균 분기 GDP의 약 1%에 해당하는 자본 이탈로 이어진다.
시나리오 3. 관세 전쟁 + 원자재 쇼크의 복합 충격
수출 단가 하락은 교역조건 악화와 외화 수입 감소로 이어지고, 이는 재정 수입 축소와 통화가치 불안을 초래한다. 원자재 수익을 기반으로 성장과 재정을 유지해온 국가일수록 투자 위축과 고용 악화가 빠르게 나타날 가능성이 크다.
중동 분쟁이 확산될 경우 원유 공급 차질로 국제유가가 배럴당 130달러까지 급등할 수 있다는 분석도 있다. 하루 2천만 배럴이 이동하는 주요 수송 항로가 봉쇄되면 물가 상승과 물류비 급등이 전 세계 교역과 금융시장을 위축시킬 위험이 있다.
📋 Core EM vs Periphery EM: 살아남을 놈, 무너질 놈 구별법
신흥국을 뭉뚱그려 보면 답이 안 나온다. 핵심(Core) 신흥국과 주변부(Periphery) 신흥국으로 나눠야 한다. 뉴욕 연준이 2026년 4월 직접 분석한 데이터를 정리했다.
구분
Core EM (핵심 신흥국)
Periphery EM (주변부 신흥국)
대표 국가
인도, 브라질, 인도네시아, 멕시코
아르헨티나, 이집트, 파키스탄, 가나
외화 부채 의존도
낮음 (20년간 지속 감소)
높음 (여전히 상당한 수준 유지)
외환보유고
수십 년간 꾸준히 확충
취약, 외부 충격 흡수력 낮음
IMF 지원 형태
예방적 조치(사전 예방)
급성 위기 상황에서의 사후 지원
중동 갈등 이후 국채 스프레드 변화
+4bps (거의 무풍)
+45bps → 332bps로 급등
신용등급 추세
2020년 이후 꾸준한 상향
정체 또는 하락 위험 상존
2026 위기 가능성
⭐ 낮음
🚨 높음
* 출처: 뉴욕 연준 Liberty Street Economics (2026년 4월), KIEP, KDI 등 종합
최근 글로벌 충격은 핵심 신흥국과 주변부 신흥국 간의 회복력 차이를 명확히 드러냈다. 주변부 신흥국은 코로나와 2022년 통화긴축 쇼크 모두에서 차입 비용이 훨씬 크게 증가했다. 중동 분쟁 발발 이후 주변부 신흥국의 국채 스프레드 중앙값은 45bp 상승해 332bp에 달한 반면, 핵심 신흥국은 같은 기간 단 4bp 상승에 그쳤다.
🏦 IMF·모건스탠리·Janus Henderson이 공통으로 경고한 것
기관들 말을 들으면 대체로 낙관적이다. 근데 그 사이사이에 숨은 경고를 읽는 게 진짜 실력이다.
신흥국 채권 디폴트 전망치는 3%로 소폭 상승했으나 여전히 역사적 평균보다 낮다. 핵심 신용 지표는 소폭 악화됐지만, 선진국보다는 여전히 강하며 펀더멘털이 견조한 만큼 시스템적 위기 발생 가능성은 낮다. 하지만—
신흥국 신용 펀더멘털은 견고한 성장을 바탕으로 양호하나, 소버린 스프레드는 현재 불편할 정도로 타이트하다. 한편 기술 밸류에이션에 대한 의구심과 예상되는 미국의 관세 인상은 2026년 시장에 하방 리스크를 증폭시킨다.
갑작스러운 자본 이탈은 외부 자금 조달 압력을 심화시키고, 차입 비용을 높이며, 급격한 통화가치 하락을 초래할 수 있다. 이러한 리스크는 중동 전쟁 맥락에서 현실화되고 있으며, 일부 신흥국에서는 이미 비거주 비은행 투자자들의 자본 이탈이 발생하고 있다.
재정 여력이 제한된 상황에서 부채 부담이 커지면 정부는 경기 대응을 위한 재정 지출을 줄일 수밖에 없고, 이는 성장 둔화와 사회적 불안을 동시에 키우는 악순환으로 이어진다. 더 나아가 국가 신용도 하락은 자본 유출과 환율 불안을 초래해 위기를 증폭시키는 촉매가 된다.
낙관론의 핵심 근거도 짚어보자. 마냥 비관만 해서도 안 된다.
2025년 신흥국 현지통화 채권은 거의 모든 고정수익 섹터 대비 총수익률과 위험조정 수익률 모두에서 우수한 성과를 냈다. JP모건 GBI-EM 글로벌 다변화 지수 기준 2025년 달러 총수익률은 19.3%를 기록했다. 이게 2026년에도 이어질 수 있냐는 건데—
신흥국 채권의 높은 캐리(이자수익), 개선되는 신용 품질, 분산 효과는 2026년 고정수익 테마로서 강력한 근거를 제공한다. 지정학적 갈등과 달러 강세 같은 리스크는 존재하지만, 견조한 펀더멘털과 저평가 상태에서 이 자산군은 계속 아웃퍼폼할 것으로 본다.
🚫 신흥국 투자·분석에서 절대로 하지 말아야 할 실수
❌ 평균 성장률만 보고 안심하기
인도·베트남이 6% 이상 성장을 이끌지만 신흥국 전체는 4.1%이며, 국가별 차별화 가능성이 높다. 평균의 함정에 빠지지 마라.
❌ 외화 부채 비율 확인 없이 투자하기
핵심 개혁 중 하나는 외화 차입 의존도 감소였다. 역사적으로 신흥국은 달러로 부채를 발행할 수밖에 없었으며, 이는 공공재정을 환율 변동에 그대로 노출시켰다.
❌ 지정학 리스크를 ‘먼 나라 이야기’로 치부하기
중동 분쟁이 확산될 경우 유가가 배럴당 130달러까지 급등할 수 있다는 분석이 있다. 이건 신흥국 에너지 수입국에 직격탄이다.
❌ 비은행 자본 쏠림 국가에 장기 투자 믿고 묻기
비은행 금융 투자자들은 신흥국의 자금 조달 접근성을 확대하지만, 글로벌 리스크 심리 변화에 매우 민감하게 반응한다. 언제든 썰물처럼 빠져나간다.
❌ Core EM과 Periphery EM을 동일 카테고리로 취급하기
핵심 신흥국은 IMF 시설과 예방적 방식으로 협력해 시장 신뢰를 강화하지만, 주변부 신흥국은 급성 스트레스 상황에서야 IMF 지원에 의존하며 차입 비용 급등과 시장 접근성 상실을 겪는 경우가 많다.
❌ 정치 이벤트를 ‘노이즈’로만 보기
2026년 주목해야 할 선거로는 브라질, 콜롬비아, 페루 대선과 헝가리, 레바논, 이스라엘, 아르메니아 총선이 있다. 선거 전후 변동성은 실제 손실로 이어진다.
❌ 원자재 수출국 신흥국에 무조건 베팅하기
원자재 가격 약세 국면은 신흥국 내부의 산업 구조 취약성을 드러내며, 경기 회복을 더욱 어렵게 만드는 시험대가 될 수 있다.
❓ FAQ: 독자들이 가장 많이 물어보는 것들
Q1. 2026년에 신흥국이 1997년 아시아 외환위기 같은 대형 위기에 빠질 가능성이 있나요?
A. 단기간에 1997년 수준의 시스템 위기가 재현될 가능성은 낮다. 핵심 신흥국들은 점진적으로 국내 자본시장을 키우고 현지통화 채권 발행 비중을 늘려왔으며, 외환보유고도 수십 년간 지속적으로 확충해 외부 충격을 흡수하고 환율을 조정할 수 있는 역량이 커졌다. 다만 주변부 신흥국은 다른 얘기다.
Q2. 미국 관세 정책이 신흥국에 미치는 직접적인 영향은 어느 정도인가요?
A. 상당히 크다. 현재 미국의 평균 관세율은 약 18%로 1930년대 이래 가장 높은 수준이다. 미국 관세가 수출과 달러 유입을 억제하면서, 많은 신흥국 발행기관들이 미국 외 다른 시장으로 자금 조달을 전환하고 있다. 수출 의존 신흥국에겐 직격타다.
Q3. 지금 신흥국 채권 ETF를 보유 중인데 어떻게 해야 하나요?
A. 무조건 팔거나 무조건 들고 있으라는 단순한 답은 없다. 핵심은 ‘어떤 신흥국이냐’다. 신흥국 채권이 2025년 다른 공채 시장을 아웃퍼폼하게 해준 요인들, 즉 견조한 수출, 하락하는 인플레이션, 완화적 통화정책은 2026년에도 지속될 것으로 전망된다. 다만 소버린 스프레드는 현재 불편할 정도로 타이트한 상황이므로, Core EM 중심으로 리밸런싱하고 Periphery EM 비중은 줄이는 전략이 현명하다.
📝 결론 및 에디터 코멘트
2026년 신흥국은 ‘평균적으로 괜찮은 척’하는 시대다. 하지만 그 평균 뒤에 인도·인도네시아·브라질 같은 Core EM의 체력과, 외화 부채로 허덕이는 Periphery EM의 균열이 동시에 존재한다. 달러 방향, VIX 수준, 지정학 이벤트 하나하나가 이 균열의 속도를 결정한다. 신흥국 전체에 베팅하는 건 2026년엔 ‘무지의 용기’다. 국가별 펀더멘털, 외화 부채 비율, 외환보유고 3가지만 체크해도 살아남는 신흥국이 보인다.
주관적 평점: 위기 가능성 전반 ★★★☆☆ (중간) | Core EM 위기 가능성 ★★☆☆☆ (낮음) | Periphery EM 위기 가능성 ★★★★☆ (높음)
에디터 코멘트 : 신흥국 얘기 나오면 다들 인도 성장률이랑 아세안 성장률만 읊는다. 근데 진짜 공부는 그 숫자 뒤에 달러 부채 얼마 있냐, 외환보유고 얼마나 쌓았냐, 비은행 자본 얼마나 들어왔냐 보는 거다. 2026년 위기는 ‘신흥국 전체’가 아니라 ‘조용히 망가지고 있던 몇 개 나라’에서 시작될 거다. 눈 똑바로 뜨고 있어라.
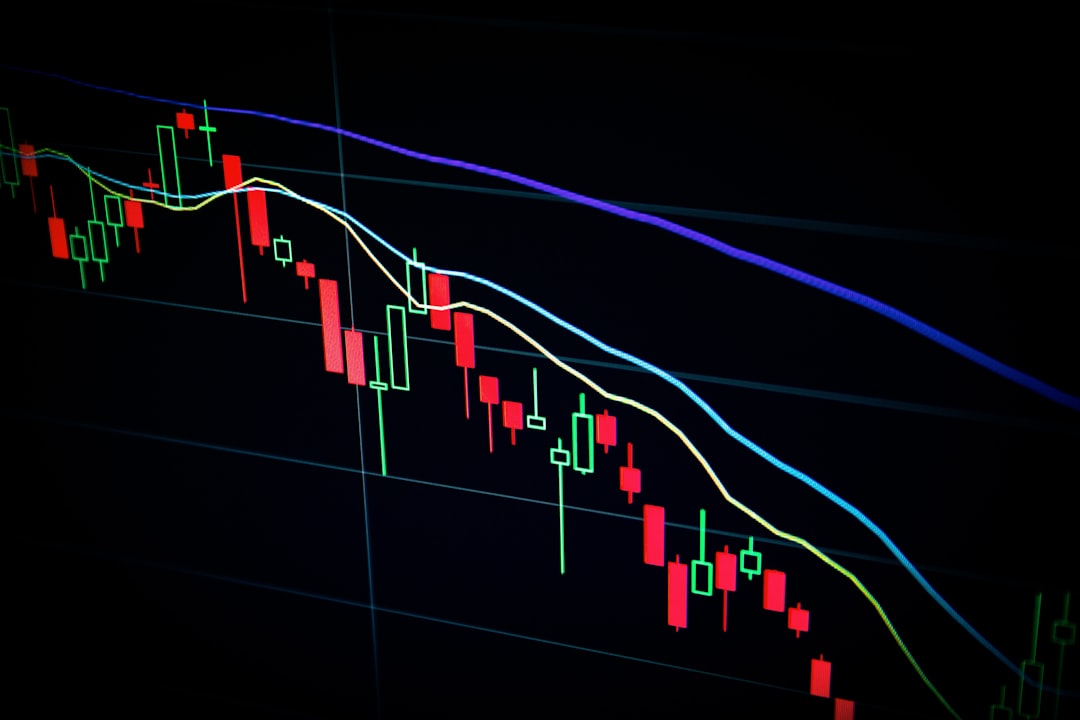
A friend of mine — a seasoned equity trader with about fifteen years under his belt — called me a few months ago, slightly frustrated. He’d been riding tech stocks hard, but volatility from tariff wars and macro uncertainty had him second-guessing his entire playbook. “I feel like I’m driving a sports car on black ice,” he said. That conversation stuck with me. What he was really asking, without saying it outright, was: where do you put your money when everything feels unstable? My answer? Let’s talk about gold, crude oil, and copper — a trio of commodities that, when structured thoughtfully into a portfolio, can act as both a shield and a spear.
Why Commodities Are Having Their Moment in 2026
Commodities are set to play a more prominent role in portfolios in 2026, with forecasts pointing to attractive returns, supported by supply-demand imbalances, heightened geopolitical risks, and long-term trends like the global energy transition. This isn’t just analyst fluff — the structural case for hard assets is genuinely compelling right now. Let’s break each leg of this three-legged stool down.
Gold: The Anchor That Keeps Getting Heavier
Gold has been the headline act for two years running, and it’s not slowing down. With gold surpassing $5,000 per ounce in January 2026, precious metals investing continues to attract capital amid geopolitical uncertainty and monetary debasement fears. What’s really fueling this? Central banks. Central banks purchased an estimated 290–300 tonnes of gold in 2025, marking the 15th consecutive year of net buying.
Central bank purchases of gold will ebb and flow with the gold price, but ultimately, the underlying motivations are less price sensitive — and purchasing will continue despite gold hitting record highs. The motivations include global economic uncertainty, security uncertainty, inflation, tariffs, and China’s push to promote the yuan as a reserve currency.
Goldman Sachs, for their part, is still bullish. Goldman Sachs sees gold prices climbing to $4,900 per ounce by December 2026 in their base case, citing structurally high central bank demand and cyclical support from U.S. Federal Reserve interest rate cuts. Meanwhile, UBS projects even higher: gold should post further gains, supported by central bank buying, large fiscal deficits, lower US real interest rates, and ongoing geopolitical risk.
From a portfolio construction standpoint, gold’s correlation advantage is hard to ignore. Gold’s correlation to the S&P 500 sits at approximately 0.1–0.3 over the long-term average (Morningstar data), making it one of the most effective diversifiers in any multi-asset portfolio.
Crude Oil: The Wildcard With a Second-Half Story
Oil is the most complex of the three — and if you’re expecting a straightforward bull case, prepare to be surprised. The consensus entering 2026 was bearish: Goldman Sachs forecast Brent and WTI crude oil to decline to 2026 averages of $56 per barrel and $52 per barrel, respectively. But geopolitics have a habit of rewriting forecasts overnight. By early March 2026, gold hit $5,413 and Brent surged above $80/bbl, driven by geopolitical shock events impacting tanker routes.
The medium-term picture for oil is more nuanced. For crude oil, UBS expects prices to start recovering in the second half of the year, as the current surplus should diminish with solid demand growth and moderating non-OPEC+ supply amid limited OPEC+ spare capacity. We enter 2026 with two oil market indicators at levels not seen since the shale revolution began in 2014: net long WTI futures contracts are at their lowest level since before 2014, and US commercial petroleum inventories are very near their lowest levels since 2014 — both potentially quite bullish for oil prices.
This is the “coiled spring” thesis — bearish sentiment, suppressed positioning, and lean inventories can snap back fast. Oil isn’t a “buy and forget” asset right now. It’s a tactical play, ideally entered on pullbacks with clearly defined stops.
Copper: The Structural Superstar Nobody’s Talking About Enough
If gold is the safe-haven anchor and oil is the volatile tactician, copper is the growth engine quietly running the whole show. Copper rose 43.93% in 2025, and its strength has carried into early 2026, with the copper price continuing to attain all-time highs, reaching $13,273.81 per metric ton.
Goldman Sachs calls copper its “favorite” industrial metal, especially in the long-run, as electrification — which drives nearly half of copper demand — implies structurally strong demand growth, and as copper mine supply faces unique constraints.
The supply side is genuinely alarming for anyone who’s looked at it closely. Banks are projecting copper in 2026 will have its biggest supply deficit in 22 years. Why? Copper mines take nearly 10 to 15 years to develop, and current supply shortages in the market due to mine closures are causing high volatility in copper prices. On the demand side, copper is necessary for wiring, data centres, next-generation power transmission, renewable energy, and power grids — with demand for copper used in AI infrastructure accelerating rapidly, as data centres can require up to 10 times the electrical load of traditional facilities.
Copper demand is projected to rise about 50% by 2040 while supply remains slow to respond, supporting a structural deficit and making it a preferred industrial exposure.
What the Big Institutions Are Actually Doing
It’s useful to look at how the major houses are structuring their commodity exposure — not to copy blindly, but to benchmark your own thinking.
Amundi Research suggests a “barbell approach” — combining gold for its hedging characteristics with selected industrial metals exposure like copper to capture the structural upside from electrification, AI, and infrastructure spending.
UBS notes that for investors with substantial allocations and significant unrealized profits in gold, broadening commodity exposure to include copper, aluminum, and agricultural assets can help diversify sources of future return.
Where mandates permit, committing at least 10% to alternative investments — strategies that can include commodity-focused funds, real assets, and other diversifiers — can provide valuable convexity against stagflationary shocks and geopolitical tail events.
Key Portfolio Data Points at a Glance
Gold Price (Jan 2026): Surpassed $5,000/oz; Goldman target $4,900/oz by Dec 2026 (upside risks noted)
Copper (LME, early 2026): All-time highs at $13,273.81/metric ton — 2026 projected to be the biggest supply deficit in 22 years
Central Bank Gold Demand: UBS projects 900 metric tons of central bank and sovereign wealth gold buying in 2026
Copper Demand Growth: UBS expects demand to grow 2.8% in 2026, supported by global manufacturing expansion and robust Chinese EV and renewables consumption
Suggested Metals Allocation: VanEck (January 2026) recommends 5–15% in metals for inflation protection and volatility hedging
Rebalancing Cadence: Quarterly; trim any position that exceeds its target weight by 10%
Practical Vehicles: How to Access Each Commodity
If you’re not trading futures directly, that’s completely fine — there are excellent alternatives. Investors can access commodities through diversified indices, exchange-traded funds (ETFs), exchange-traded commodities (ETCs), or structured investments. For gold, the most widely used ETF remains SPDR Gold Shares (GLD), while copper exposure can be gained through ETFs like Global X Copper Miners (COPX) or directly via LME-linked products. For oil, iPath Series B S&P GSCI Crude Oil ETN or energy sector ETFs like XLE offer relatively liquid exposure without the complexity of rolling futures contracts.
For those comfortable with individual equities, Barrick Gold emphasizes cost optimization and strong dividend generation, with strategic expansion into copper for dual commodity resilience and an estimated dividend yield of 2.3% for 2026. On the pure copper side, increased M&A activity reinforces the premium being placed on long-duration copper exposure, signaling that the largest miners are orienting portfolios toward copper.
Risk Management: The Part Most Investors Skip
Let’s be real — commodities are volatile. Investors should be aware of unique risks such as price swings and costs associated with futures or physical holdings. Here’s how to keep yourself honest:
Position sizing: No more than 5–10% per individual stock or single commodity exposure
Profit-taking rule: Sell 25% of a position after 50–100% gains to lock in capital
Trailing stops: Trail stops 15–25% below peaks to ride momentum while protecting gains
Oil-specific caution: Treat oil as a tactical, not strategic, position — geopolitical spikes can reverse as fast as they appear
Scenario modeling: Instead of chasing price targets, model scenarios such as recessions, financial stresses, and supply outages, and size positions to reflect both probability and impact
Realistic Alternatives If Full Commodity Exposure Feels Too Heavy
Not everyone needs or wants a dedicated commodity sleeve. If a pure commodity allocation feels like too much, consider these options:
Multi-asset commodity ETFs: Products like the iShares Bloomberg Roll Select Commodity Strategy ETF (CMDY) give blended exposure across gold, oil, and metals with built-in diversification.
Commodity-linked equities: Investing in diversified miners (Barrick, Freeport-McMoRan) blends commodity upside with corporate earnings stability and dividends.
Inflation-linked bonds (TIPS) + gold: A lighter-touch hedge combination that doesn’t require active commodity management.
Structured products: Some banks offer capital-protected notes with upside participation in commodity indices — useful for risk-averse investors who still want inflation protection.
Commodities have experienced long periods of strong out- and underperformance versus equities — which is why they are generally best viewed as a tactical, not permanent, component of a long-term portfolio. That’s not a reason to avoid them; it’s a reason to size them thoughtfully.
Editor’s Comment : After years of watching clients under-allocate to commodities and then scramble during inflationary shocks, the 2026 environment finally makes the case crystal clear. Gold gives you the safe-haven floor. Copper gives you the structural growth ceiling. Crude oil? It’s your geopolitical barometer — respect it, don’t overweight it. If there’s one mental model I keep coming back to, it’s Amundi’s “barbell” framework: anchor with gold, lean into copper for the long arc of electrification and AI, and use oil tactically on dips. You don’t need to be 100% right on any single commodity — you just need to be in the right room when the market finally shows up. That room, in 2026, has gold, copper, and oil in it.
지인 중에 투자를 꽤 한다는 친구가 있다. 작년에 주식으로 쪽박 찬 뒤로 요즘 원자재 쪽으로 눈을 돌리고 있는데, 어느 날 술자리에서 이런 말을 꺼냈다. “금이 오른다는 건 알겠는데, 구리는 왜 사야 해? 원유는 지는 해 아니야?”
솔직히 그 질문이 틀리지 않았다. 표면만 보면 그렇게 보인다. 그런데 실제로 2026년 원자재 시장 속을 파고들면 얘기가 완전히 달라진다. 금은 온스당 $4,600선을 넘어섰고, 구리는 LME에서 역대 최고가를 찍었으며, 원유는 지정학적 변수 속에서 ‘역설적 기회’를 만들고 있다. 이 세 자산을 어떻게 조합하느냐에 따라 헤지(Hedge)와 성장(Growth)을 동시에 잡을 수 있다.
지금부터 숫자와 함께 파헤쳐 본다.
1. 2026년 현재 금·원유·구리 가격 현황과 핵심 수치
먼저 지금 시장이 어떤 상태인지 숫자로 확인하자. 감으로 투자하는 시대는 끝났다.
🥇 금 (Gold / XAU)
금 가격은 2026년 4월 기준 온스당 $4,654 수준에서 움직이고 있다. 불과 1년 전과 비교하면 약 44.88% 상승한 수치다. 단기 조정이 있었지만, 중장기 상승 추세는 여전히 살아있다.
2026년 4월 12일 금 가격은 $4,654.25/t.oz를 기록했으며, 지난 한 달간 7.32% 하락했지만 여전히 1년 전 대비 44.88% 높은 수준을 유지하고 있다.
JP모건은 금 가격이 2026년 말까지 온스당 $5,055 수준까지 상승할 가능성이 있다고 전망했으며, HSBC는 2026년 상반기에 $5,000 도달 가능성을 제시하면서도 가격 변동성 확대 가능성을 언급했다.
JP모간은 $5,055, 뱅크오브아메리카와 HSBC는 $5,000, 골드만삭스는 $4,900을 연말 목표가로 제시하며 상승 흐름이 지속될 것으로 내다봤다.
🟤 구리 (Copper / HG)
구리는 2026년의 진짜 주인공이다. 구리 가격은 LME에서 2026년 1월 기준 톤당 $13,238(약 $6/lb)를 기록하며 역사적 고점을 찍었다.
구리는 2026년 초 파운드당 $5.89 수준에서 출발했으며, 이는 2025년의 40% 이상 랠리를 이어받은 것이다. 현재(2026년 4월)는 파운드당 $5.75 수준에서 안정세를 보이며 3주 연속 주간 상승세를 이어가고 있다.
🛢️ 원유 (Crude Oil / WTI·Brent)
원유는 세 자산 중 가장 변동성이 크다. 골드만삭스는 2026년 평균 Brent $56/bbl, WTI $52/bbl를 전망하며 구조적 하방 압력이 지속될 것으로 봤다. 그러나 호르무즈 해협 리스크 등 지정학적 변수가 단기 급등의 씨앗이 되고 있다는 점에서 단순히 ‘버릴 자산’은 아니다.
2. 세 자산 완전 비교표: 수익률·변동성·상관관계
포트폴리오 구성에서 가장 중요한 건 각 자산의 ‘역할’을 이해하는 것이다. 아래 표를 보면 왜 이 세 자산이 함께 있어야 하는지 바로 이해된다.
이론은 됐고, 실제로 어떻게 배분하란 말인가? 월가의 메이저 기관들이 내놓은 숫자를 그대로 가져왔다.
VanEck의 2026년 1월 보고서에 따르면 인플레이션 방어와 변동성 헤지를 위해 전체 포트폴리오의 5~15%를 금속 자산에 배분할 것을 권고했다.
아문디(Amundi)는 ‘바벨 전략’을 제안하며, 헤지 특성이 강한 금과 전기화·AI·인프라 수요 성장을 위한 산업금속(구리 등) 노출을 결합할 것을 권장했다.
세계금협회(World Gold Council)의 2026년 1월 6일 자료에 따르면, 중앙은행들은 2025년에만 금을 약 290~300톤 순매수했으며, 이는 15년 연속 순매수 기록이다. 이 ‘큰 손’들이 계속 산다는 건, 이유가 있다는 뜻이다.
📊 추천 포트폴리오 비율 (공격형 / 중립형 / 방어형)
투자 성향
금 비중
구리 비중
원유 비중
기타 (현금·주식)
공격형
30%
40%
15%
15%
중립형
40%
30%
15%
15%
방어형
60%
20%
10%
10%
※ VanEck, Amundi, Goldman Sachs 보고서 데이터를 바탕으로 재구성. 개인 투자 판단은 반드시 본인 리스크 성향을 기준으로 할 것.
4. 구리가 ‘다음 빅 트레이드’인 이유: AI·EV 수요 폭발
원자재 투자 경험이 있는 사람도 구리의 진짜 이야기를 모르는 경우가 많다. 이건 단순히 ‘경기 민감주’가 아니다.
구리의 중장기 전망은 구조적으로 강세다. 2040년까지 소비량이 약 50% 증가할 것으로 전망되며, 이는 AI 데이터센터, 재생에너지, 전기차(내연기관 대비 3배 구리 사용), 그리드 현대화가 주된 동력이다. 이 경우 글로벌 수요는 약 4,200만 미터톤에 달할 수 있다.
구리는 배선, 데이터센터, 차세대 전력 송전, 재생에너지, 전력망에 필수적이며, 특히 AI 인프라 구축에 필요한 수요가 급속도로 가속화하고 있다. AI 데이터센터는 기존 시설 대비 최대 10배의 전력 부하를 필요로 한다.
골드만삭스는 구리를 ‘가장 선호하는 산업금속’으로 지목하며, 전기화가 구리 수요의 거의 절반을 차지하는 상황에서 구조적으로 강한 수요 성장과 광산 공급의 독특한 제약이 맞물린다고 분석했다.
VanEck도 2026년 금속·광업 섹터에서 구리가 특히 유리한 위치에 있다고 보았으며, 공급 차질, 제한된 프로젝트 파이프라인, 긴 개발 기간이 EV·그리드 투자·디지털 인프라의 급증하는 수요와 교차하는 지점이라고 분석했다.
5. 원유, 사줘야 해? 말아야 해? 냉정한 판단
솔직히 말한다. 원유는 ‘메인 디시’가 아니다. 2026년 포트폴리오에서 원유는 ‘사이드’로 넣되, 비중을 무작정 늘리면 안 된다.
2026년 초 WTI 선물 순매수 계약 수는 2014년 이전 이후 최저 수준이다. 즉, 펀드매니저들이 유가 상승에 거의 대비하지 않은 상태다. 미국 상업용 석유 재고(원유, 휘발유, 경유)도 2014년 이후 최저 수준에 근접해 있어 이 두 지표 모두 잠재적으로 유가에 강세 신호를 보내고 있다.
하지만 역풍도 있다. 셰브런, 엑슨모빌, 쉘이 텡기즈·카샤간 유전에 10년간 투자하며 생산량을 끌어올린 공급 증가가 OPEC 쿼타를 위협하고 있으며, 러-우 평화 협정 가능성은 러시아산 석유의 시장 재진입을 의미할 수 있다.
State Street의 Gold Monitor(2026년 4월)에 따르면 유가가 $80~85/bbl로 정상화될 경우 금 가격은 $5,000/oz 위로 빠르게 복귀할 수 있다. 즉, 원유와 금은 서로 연동되는 측면이 있다. 유가 급등 시 인플레이션 헤지로 금도 오른다는 점을 기억해 둘 것.
6. 절대로 하지 말아야 할 원자재 투자 실수 7가지
15년간 시장에서 직접 보고 겪은 실수들이다. 아래 중 하나라도 해당되면, 지금 당장 멈춰야 한다.
❌ 단일 자산에 올인: 금만, 구리만, 원유만 사는 건 ‘도박’이다. 세 자산의 상관관계가 다르기 때문에 분산이 핵심이다.
❌ 레버리지 ETF 장기 보유: 2x, 3x 레버리지 원자재 ETF는 단기 트레이딩 도구다. 장기 보유 시 ‘롤오버 비용’으로 원금이 녹는다.
❌ 선물 만기일 무시: 원유 선물을 잘못 보유하다 2020년처럼 마이너스 유가 사태를 맞을 수 있다. 만기 롤오버 시 발생하는 ‘콘탱고(Contango)’ 비용은 반드시 계산해야 한다.
❌ 지정학 뉴스에 즉각 반응: 호르무즈 해협 위기, 중동 분쟁 뉴스가 터질 때 패닉 바잉/셀링하면 99%는 고점·저점에서 물린다.
❌ 금 현물과 금 ETF를 동일하게 취급: KRX 금시장의 현물 금과 GLD 같은 ETF는 세금 구조, 유동성, 프리미엄이 다르다. 같은 자산이라고 착각하면 안 된다.
❌ 리밸런싱 미실시: 분기마다 리밸런싱하고, 목표 비중 대비 10% 초과 시 반드시 트리밍(Trimming)해야 한다. 안 하면 어느새 특정 자산이 포트폴리오를 지배하게 된다.
❌ 중국 수요 변수 무시: 칠레가 세계 구리 채굴의 1/3 이상을 차지하며, 구리의 최대 수입국은 중국이다. 중국 경기 및 정책 변화는 구리 가격을 단기에 20~30% 요동치게 만들 수 있다.
FAQ: 독자들이 가장 많이 묻는 질문 3가지
Q1. 금이 이미 많이 올랐는데 지금 들어가도 늦지 않은가요?
늦었다고 느낄 때가 종종 중간이다. 경제 전문가들은 ‘폴리크라이시스(다각적 위기)’ 시대에 금이 제공하는 분산 투자 효과와 하락 방어 능력이 그 어느 때보다 절실하다고 강조한다. 이것이 투자자들이 금을 포트폴리오에서 쉽게 빼지 못하는 이유다. 단, 한 번에 풀베팅이 아니라 분할 매수로 접근하는 것이 정석이다. 고점에서 전액 매수하면 단기 조정에 멘탈이 흔들린다.
Q2. 구리 ETF와 구리 관련 광산주 중 어느 것이 더 낫나요?
이건 ‘레버리지를 원하느냐’의 문제다. 구리 현물 ETF(예: CPER)는 구리 가격에 직접 연동되지만, 광산주(SCCO, FCX 등)는 구리 가격 상승 시 더 높은 수익을 낼 수 있는 반면 기업 리스크(경영, 노조, 사고 등)도 함께 따라온다. 개별 종목은 한 종목당 5~10%를 넘기지 말고, 50~100% 수익 달성 시 25%는 익절해 원금을 보호하는 전략이 권장된다.
Q3. 원유를 포트폴리오에 넣어야 할 이유가 정말 있나요?
있다. 단, ‘성장 자산’이 아니라 ‘인플레이션 헤지 및 지정학 보험’으로 포지셔닝해야 한다. 원유는 비대칭적 지정학 테일 리스크(Tail Risk)에 노출되어 있다. 즉, 평시엔 조용하다가 갑자기 20~40% 급등하는 자산이다. 전체 포트폴리오의 10~15% 이상 담지 말고, 나머지는 금과 구리에 집중하는 것이 합리적이다.
결론: 2026년 원자재 포트폴리오, 이렇게 짜라
2026년 원자재 시장은 단순하지 않다. 금은 ‘방어막’, 구리는 ‘성장 엔진’, 원유는 ‘지정학 보험’으로 역할이 명확하게 나뉜다. 이 세 자산을 적절한 비율로 조합하면 어지간한 주식 포트폴리오보다 리스크 대비 수익률이 높다.
금속 원자재는 인플레이션 헤지, 주식·채권과의 낮은 상관관계, 성장 레버리지를 동시에 제공하는 대안 투자의 핵심 자산이다. 금과 산업금속의 균형 잡힌 바벨 전략은 포트폴리오 회복력을 실질적으로 높일 수 있다.
핵심 요약:
✅ 금: 포트폴리오의 닻. 비중 40~60% (방어형) / 30% (공격형)
✅ 구리: AI·EV 시대의 핵심 성장 자산. 20~40% 배분
✅ 원유: 인플레이션 보험. 10~15% 이내로 제한
✅ 분기마다 리밸런싱, 레버리지 ETF 장기 보유 절대 금지
에디터 코멘트 : 금·원유·구리는 ‘복잡한 자산’처럼 보이지만, 알고 보면 각자의 역할이 가장 명확한 원자재 삼총사다. 지금 당장 완벽한 비율을 찾으려 하지 말고, 일단 소액으로 세 자산에 발을 담가보라. 시장은 공부보다 ‘경험’이 더 빠르게 가르쳐 준다. 단, 레버리지는 경험 쌓인 후에.
A colleague of mine who manages a mid-sized European equity fund called me a few weeks ago, half-joking, half-panicked. “It’s like 1973 all over again,” he said, “except this time we don’t even have a booming economy to lose first.” He was referring, of course, to the gut-punch that’s been building across the eurozone since the Middle East conflict flared in March 2026 — rising energy prices colliding head-on with already-sluggish growth. That conversation stuck with me, and I’ve spent a lot of time since then digging through the data and institutional forecasts to understand just how real this stagflation risk actually is. Let’s think through it together.
What Is Stagflation, and Why Does Europe Have a Uniquely Bad Allergy to It?
Stagflation — the toxic cocktail of stagnant growth and rising inflation — is every central banker’s nightmare precisely because the usual policy tools cancel each other out. If you raise rates to fight inflation, you suffocate growth. If you cut rates to stimulate the economy, you fan the inflationary flames. It’s a genuine policy trap, and Europe in 2026 is sitting right on the edge of one.
EU economy commissioner Valdis Dombrovskis has warned that Europe faces a stagflationary shock — low growth combined with rising inflation — despite the Iran-US ceasefire. This warning didn’t come out of nowhere. The war in the Middle East has brought renewed uncertainty and the economic outlook is clouded again. Disruptions to shipping through the Strait of Hormuz, a key route for global oil and liquefied natural gas (LNG) trade, together with attacks on energy infrastructure, have led to significant volatility in global energy markets and have pushed up oil and gas prices.
Among the advanced economies not directly involved in the conflict, Europe is one of the most exposed given its high import dependence, the sensitivity of industrial activity to energy costs, and the speed at which global price shocks pass through to domestic inflation and broader confidence. That’s the core vulnerability — Europe didn’t choose this fight, but it may end up paying the highest price for it.
Breaking Down the Numbers: Two Scenarios, One Grim Common Thread
Let’s get into the data, because this is where it gets really important for anyone managing risk — whether that’s a portfolio, a business, or just your own financial planning.
ECB staff expect economic growth to average 0.9% in 2026, 1.3% in 2027, and 1.4% in 2028. Meanwhile, compared with the December 2025 projections, the outlook for headline HICP inflation has been revised up by 0.7 percentage points for 2026, mainly owing to the energy component. That’s a significant upward swing in a very short period of time.
Vanguard’s analysis draws a clear line between two trajectories. Under a scenario in which oil prices average $90–$100 per barrel and gas prices average €60/MWh for one to two quarters, the 2026 GDP growth forecast has been reduced by 0.4 percentage points to 0.8%. The 2026 headline inflation forecast has been revised upward to 2.5%, while core inflation has been lifted more modestly to 2.1%.
The European Commission’s own dual-scenario framework tells a similar story. Under the first scenario — in which energy prices return to pre-war levels by the end of 2026 — growth slows by 0.4 percentage points this year and inflation rises by up to one percentage point above previous forecasts. That is painful but manageable. Under the second scenario — in which energy prices take longer to normalise — growth slows by 0.6 percentage points both this year and next, and inflation rises by up to 1.5 percentage points in both years.
And in Allianz’s most dire downside scenario, a prolonged closure of the Strait of Hormuz (more than 3 months) would magnify the economic shock, with oil rising temporarily to 180 USD/bbl and gas to 200 €/MWh, pushing the Eurozone into a technical recession (annual growth at just +0.2%). Inflation would peak at 4.6% in the Eurozone, forcing central banks into a more aggressive tightening response despite the economic slowdown, including potentially three ECB rate hikes.
The ECB’s Impossible Dilemma
This is the part that keeps rate-watchers up at night. Stagflation creates a policy trap that central banks are specifically ill-equipped to handle. The ECB’s mandate is price stability. When inflation is above target, its instinct is to raise rates or hold them high. But when growth is simultaneously collapsing, rate hikes deepen the economic damage. The ECB cannot cut to support growth without risking embedding inflation — and it cannot raise to fight inflation without accelerating the slowdown.
The policy stance of the European Central Bank is on a knife edge and firmly data dependent. Vanguard continues to expect policy rates to remain on hold, with the Governing Council attempting to look through an energy-driven inflation shock. Meanwhile, Allianz expects the ECB is likely to deliver a +25bps hike to anchor expectations, then pause as growth weakens. The divergence in expert views itself tells you something: nobody really knows what the right move is here.
Country-by-Country: Europe Is Not One Economy
One thing that often gets lost in the macro narrative is the staggering divergence between eurozone member states. This isn’t a uniform crisis — it’s several overlapping ones.
Germany: Germany’s fiscal package makes it a high-growth market for 2026, with GDP growth already accelerating in 2025 after three years of stagnation, and manufacturing orders surging by 9.6% in Q4. But this momentum is now under pressure from energy cost spikes.
Spain & Portugal: In Southern Europe things are moving at two speeds, with Spain and Portugal pulling ahead while Italy lags. Both Iberian markets are predicted to see GDP growth above 2% in 2026.
France: France is expected to expand by just 0.9% in 2026, after growing 0.7% in 2025, before recovering to 1.1% in 2027.
Italy: Italy is expected to grow just 0.8% in both 2026 and 2027 — dangerously close to the stagnation threshold when paired with rising energy inflation.
Broader ECA Region: European and Central Asian (ECA) developing economies are expected to slow significantly in 2026, with geopolitical tensions and the Middle East conflict cited as major factors.
Policy Response: What Brussels Is Actually Doing About It
To be fair, European institutions aren’t just watching helplessly. In its March 2026 conclusions, the European Council called on the Commission to present a toolbox of targeted temporary measures to deal with recent spikes in imported fossil-fuel prices, alongside concrete steps to lower electricity prices and curb excessive volatility.
Commissioner Dombrovskis told Parliament that the Commission is preparing proposals that would lower electricity taxation relative to fossil fuels, improve grid efficiency and revisit parts of the Emissions Trading System, including the Market Stability Reserve, in an effort to reduce price swings. Longer term, Dombrovskis argued that the strategic priority remains the transition to a more electrified European economy, with stronger grids and lower dependence on volatile fossil-fuel markets.
There are also structural positives that could act as buffers. Industrial production gained momentum in the second half of 2025 and fortified the labour market, boosting job creation to 1.12 million for the full year and driving the unemployment rate to a low of 6.2%. This momentum was funded by record-high disbursement in the EU’s Recovery and Resilience Facility (RRF), which sharply accelerated in the second half of 2025, reaching EUR 86bn by the end of the year.
What Investors and Risk Managers Should Watch in 2026
If you’re thinking about how to position yourself or your business in this environment, here are the key variables that will define whether Europe tips into full stagflation or threads the needle:
The Strait of Hormuz: The distinction between the two economic scenarios rests almost entirely on whether the Strait of Hormuz reopens fully and durably. Watch tanker traffic data weekly.
ECB rate decisions: Every Governing Council meeting is now a live wire. Any hint of a hawkish pivot will send Eurozone equities lower and credit spreads wider.
Energy futures curves: ECB projections suggest quarterly average oil and gas prices will peak at around USD 90 per barrel and €50 per MWh respectively in Q2 2026 and will then decline. If this trajectory breaks to the upside, all bets are off.
Consumer confidence indicators: Broader uncertainty, volatility, and higher inflation would further deteriorate business and consumer confidence, prompting businesses to scale back investments and consumers to spend less.
German fiscal execution: Germany’s defence and infrastructure spending is a genuine growth wildcard for the rest of the eurozone — delays or political friction would remove a key buffer.
Capital market stress indicators: In a severe downside scenario, capital markets would face a clear risk-off regime: higher yields, sharp equity corrections with a max drawdown of -30% in Europe, and materially wider credit spreads.
Realistic Alternatives to Despair: Navigating This Environment
Here’s where I want to push back against the doom narrative a little, because the data does offer some realistic handholds for those willing to look carefully.
First, the euro area remains particularly sensitive to energy shocks given its reliance on energy imports, but inflation expectations remain broadly anchored, reflecting a more favorable starting point than during previous shocks. This matters enormously — the 1970s stagflation spiral was driven partly by unanchored expectations feeding into wage-price spirals. That dynamic isn’t present today, at least not yet.
Second, for investors, geographic diversification within Europe makes sense right now. Spain and Portugal’s structural outperformance, Germany’s fiscal-driven industrial rebound, and the ongoing RRF disbursements offer pockets of real opportunity even in a broadly sluggish environment.
Third, for businesses operating in Europe, now is the time to seriously model energy cost scenarios into your forward planning. Companies that locked in fixed-price energy contracts or invested in on-site renewables before the current spike are already operating at a structural cost advantage. That gap will widen if the Hormuz situation drags on.
Editor’s Comment : Europe’s 2026 stagflation risk is real, data-backed, and actively being flagged by everyone from the ECB to Vanguard to Allianz — so don’t let anyone dismiss it as fear-mongering. But it’s also not yet a certainty. The policy response is underway, structural buffers exist, and the worst scenarios remain contingent on geopolitical variables that could shift quickly. The smartest approach right now isn’t panic — it’s precision: know your energy exposure, know your currency risk, watch the Strait of Hormuz like a hawk, and build scenario buffers into every major financial decision you make this year. The investors and business leaders who treat this as a live risk rather than a distant possibility are the ones who’ll be best positioned when the fog clears.
태그: Europe stagflation 2026, eurozone inflation risk, ECB monetary policy, European economic outlook, energy shock Europe, euro area GDP forecast, Middle East energy crisis Europe
지인 중에 유럽 ETF에 꽤 묻어둔 친구가 있다. 얼마 전 술자리에서 대뜸 물어왔다. “야, 유럽 경제 진짜 괜찮은 거야? 뉴스 보면 뭔가 불안한데.” 나는 잠깐 생각하다가 맥주잔을 내려놓고 말했다. “괜찮지 않아. 근데 대부분 사람들은 그게 얼마나 심각한지 모르고 있어.”
2026년 현재, 유럽 경제는 스태그플레이션(Stagflation)이라는 단어가 공식 석상에서 등장하기 시작했다. 스태그플레이션이란 경기침체(Stagnation)와 인플레이션(Inflation)이 동시에 발생하는 최악의 조합이다. 금리를 올리자니 경기가 더 죽고, 금리를 내리자니 물가가 더 오른다. 중앙은행 입장에서는 그야말로 ‘진퇴양난’의 덫이다.
이 글은 그 ‘덫’이 얼마나 현실적인지, 그리고 당신이 지금 어떻게 대응해야 하는지를 데이터와 함께 직설적으로 파헤친다.
📌 1. 수치로 보는 유럽의 민낯 – GDP 0.8%의 공포, 지금 어디까지 왔나
📌 2. 스태그플레이션의 구조적 원인 – 중동발 에너지 쇼크가 뇌관이 된 이유
📌 3. 기관들은 뭐라고 하나 – 골드만삭스·ECB·알리안츠의 시나리오 비교표
📌 4. 절대 하면 안 되는 투자 실수 5가지 – 지금 유럽 경제 공포 앞에서 쪽박 차는 패턴
📌 5. FAQ – 독자들이 댓글로 꼭 묻는 현실적인 질문들
1. 수치로 보는 유럽의 민낯 – GDP 0.8%의 공포, 지금 어디까지 왔나
먼저 팩트부터 깔고 들어가자. 좋은 소식과 나쁜 소식이 공존한다. 좋은 소식은, 유럽이 2025년까지만 해도 일정 수준 버텨왔다는 것. 나쁜 소식은, 2026년 현재 상황이 빠르게 악화되고 있다는 점이다.
2025년 4분기 유로존 GDP는 전분기 대비 0.2% 성장에 그쳤으며, 이는 3분기의 0.3%에서 더 둔화된 수치다. 성장 엔진이 꺼져가고 있다는 신호다. 2026년 1월에는 유로존 산업생산이 전월 대비 무려 1.5% 감소했다. 제조업이 흔들리고 있는 것이다.
그런데 설상가상, 물가는 잡히질 않는다. ECB 3월 전망에 따르면 유로존 헤드라인 인플레이션은 2025년 2.1%에서 2026년 2.6%로 상승할 것으로 예측되며, 이는 유가와 가스 도매가격의 급등을 반영한다.
가장 충격적인 수치는 뱅가드(Vanguard)의 시나리오 분석이다. 유가가 배럴당 90~100달러, 가스 가격이 MWh당 60유로 수준을 1~2분기 유지하는 시나리오에서, 뱅가드는 2026년 유로존 GDP 성장률 전망치를 0.4%p 하향 조정해 0.8%로 제시했다. 0.8%. 이건 성장 둔화가 아니다. 사실상 정체(Stagnation)다.
유럽연합 집행위원회의 최악 시나리오에서는 에너지 가격 정상화가 지연될 경우, 올해와 내년 모두 성장률이 0.6%p 하락하고 인플레이션이 1.5%p 추가 상승하면서 EU 성장률이 약 0.8%에 그칠 수 있으며, 이는 성장 둔화가 아닌 사실상 침체이자 기술적 스태그플레이션의 정의를 충족한다.
2. 스태그플레이션의 구조적 원인 – 중동발 에너지 쇼크가 뇌관이 된 이유
왜 하필 유럽이 이렇게 취약한가? 단순히 중동 전쟁 때문이라고 생각하면 오산이다. 그건 방아쇠일 뿐이고, 총 자체는 훨씬 전부터 장전돼 있었다.
① 에너지 수입 의존도
선진국 중 유럽은 높은 에너지 수입 의존도, 에너지 비용에 민감한 산업 구조, 그리고 글로벌 가격 충격이 국내 인플레이션과 신뢰에 전달되는 속도 측면에서 직접 분쟁 당사국이 아닌 국가들 중 가장 취약한 지역 중 하나다.
② 호르무즈 해협 리스크
전 세계 원유의 약 20%와 LNG가 통과하는 호르무즈 해협이 핵심 에너지 병목이며, 해운 차질이나 걸프 공급 축소 시 글로벌 시장이 즉각 긴축되며 유럽의 에너지 수입 비용이 급등한다.
③ 천연가스 가격 폭등
유럽 가스 허브인 네덜란드 TTF거래소에서 천연가스 4월물은 이란 공습 이전 MWh당 31.96유로에서 이틀 만에 63.75유로로 배 이상 폭등했다. 2거래일 만에 100% 상승. 기업 생산 원가가 하루아침에 두 배가 됐다는 얘기다.
④ ECB의 정책 딜레마
스태그플레이션은 중앙은행이 다루기 특히 어려운 정책 함정을 만든다. ECB의 임무는 물가 안정이다. 인플레이션이 목표를 초과하면 금리를 올리거나 높게 유지해야 하지만, 동시에 성장이 붕괴되면 금리 인상은 경제적 피해를 심화시킨다. ECB는 인플레이션과 싸우기 위해 금리를 올리면서 동시에 경기 침체를 가속화할 수 없는 딜레마에 빠져 있다.
⑤ 재정 건전성 악화
독일은 방위비 및 인프라 지출을 확대하고, 프랑스의 재정긴축 개혁이 저항에 부딪히면서 재정 건전성 우려가 장기화될 전망이다.
⑥ 보호무역주의 직격탄
미국발 보호무역주의 확산과 미중 대립 등에 따른 국가 간 장벽이 공급망 분리로 이어지면서 비효율성이 고착화될 경우, 관련 비용이 연간 1조 달러에 달하고 전 세계 경제성장률도 0.3%p 하락할 우려가 있다.
3. 기관들은 뭐라고 하나 – 주요 기관 시나리오 비교표
자, 이제 각 기관이 제시하는 숫자를 한 표에 정리해보자. 이게 스니펫 캡처하기 딱 좋다.
기관
2026 유로존 GDP 성장률
2026 인플레이션
ECB 금리 방향
주요 리스크
ECB (2025.12 기준)
1.2%
1.9% → 2.6%↑ (중동 쇼크 반영)
동결 또는 소폭 인상
에너지 가격 상승, 서비스 인플레이션
골드만삭스
0.7% (전쟁 이후 하향)
3.2% (Q2 기준)
연내 3회 인상 가능
스태그플레이션 리스크 증가, 비선형 하방 리스크
뱅가드 (Vanguard)
0.8% (에너지 쇼크 시나리오)
상방 위험 우세
동결, 인상 리스크 존재
중동 분쟁 장기화 시 스태그플레이션 쇼크
알리안츠 (Allianz)
0.8%
4.6% (최악 시나리오)
ECB +25bp 인상 후 동결
호르무즈 봉쇄 장기화 시 기술적 침체
EU 집행위
최악 시 ~0.8%
기존 전망 대비 +1.5%p
스태그플레이션 경고 공식 발령
에너지 정상화 지연 여부가 핵심 변수
Conference Board
1.3% (베이스라인)
2% 수렴, 상방 리스크
서사 전환 가능성
제조업 압박, 소비심리 위축
KCIF (국제금융센터)
1.1% (EU)
물가-고용 부조화
동결
AI 버블, 재정 악화, 보호무역주의
※ 기관별 전망치는 2026년 3~4월 기준 최신 업데이트 자료 반영. 중동 사태 전개에 따라 수치 변동 가능.
보이는가? 낙관적인 기관조차 1.3%를 넘기기 힘들다고 본다. 골드만삭스 데이터에 따르면 스태그플레이션 기간 동안 STOXX 600의 분기별 실질 수익률 중간값은 약 -1%로 하락하며, 그렇지 않은 경우의 +3%와 대조된다. 주식 시장 관점에서도 스태그플레이션은 재앙이다.
알리안츠는 더 극단적인 시나리오도 제시한다. 호르무즈 해협이 3개월 이상 봉쇄되는 최악의 경우 유가가 일시적으로 180달러까지 치솟고, 유로존은 기술적 침체(연간 성장률 +0.2%)에 빠질 수 있다고 경고한다. 이 경우 유로존 인플레이션은 4.6%까지 치솟고 ECB는 경기 침체 속에서도 금리를 세 차례 인상해야 하는 상황에 내몰릴 수 있다.
인플레이션 우려에 ECB가 정책금리를 추가로 내릴 것이라는 기대가 사라지고 금리 인상 가능성이 제기됐으며, 블룸버그에 따르면 시장은 ECB의 금리 인상 가능성을 60% 이상으로 반영했다. 단 몇 주 만에 시장 컨센서스가 180도 뒤집힌 것이다.
뱅가드는 “중동 긴장에서 비롯된 에너지 가격의 급격한 상승은 유럽 경제에 심각한 스태그플레이션 충격의 리스크를 야기하며, 이것이 지속되거나 가속화되면 ECB가 정책 기조를 재평가할 수밖에 없을 것”이라고 명시했다.
4. 절대 하면 안 되는 투자 실수 5가지 – 지금 유럽 경제 공포 앞에서 쪽박 차는 패턴
이제 실전이다. 유럽발 스태그플레이션 리스크가 현실화되는 국면에서 개인 투자자들이 자주 저지르는 치명적인 실수들을 정리했다. 메모해라.
❌ 실수 1: “어차피 일시적이겠지” 안일함
최악 시나리오—즉, 더 심각한 쪽—는 꼬리 리스크(Tail Risk)가 아니다. 그것은 현실적인 기본 시나리오(Plausible Base Case)다. 스태그플레이션을 일시적 노이즈로 치부하고 유럽 성장주·소비재를 들고 버티는 건 위험하다.
❌ 실수 2: 유럽 자동차·화학 주식 물타기
골드만삭스는 임의소비재, 자동차, 화학 섹터에 비중 축소를 권고하는 방어적 포지셔닝을 유지하고 있다. 지금 ‘싸졌다’고 유럽 완성차(Volkswagen, Stellantis)나 화학주 담다가 장기 침체 늪에 빠질 수 있다.
❌ 실수 3: ECB 금리 인하 베팅을 그대로 유지
불과 몇 달 전까지 2026년 ECB 금리 인하가 대세 컨센서스였다. 지금은? ECB의 내러티브 전환이 이제 더 가능성이 높아 보인다. 인하 기대에 베팅한 채권 포지션은 즉각 재검토해야 한다.
❌ 실수 4: 유럽 에너지 취약국 국채 방심
2026년 2월 기준 루마니아(8.3%), 슬로바키아(4.0%), 크로아티아(3.9%) 등 남·동유럽 일부 국가들은 여전히 고인플레이션 상태다. 이 국가들의 국채는 ECB 금리 인상 시 가격이 직격탄을 맞는다.
❌ 실수 5: 보호무역 리스크를 유럽 밖 이야기로 착각
높은 에너지 가격, 높은 인건비, 낮은 수출 경쟁력으로 이미 압박받는 제조업에 원자재 투입 비용 상승이 더해지면 유럽 제조업 섹터는 더욱 벼랑 끝으로 몰린다. 수출 의존도 높은 한국 기업들도 간접 타격권이다.
그렇다면 지금 무엇을 봐야 하나 – 방어적 체크리스트
✅ 에너지·방위산업 섹터 비중 확인: 골드만삭스는 방위산업과 재정 인프라를 선호하며, 유럽 은행들이 스태그플레이션 결과를 회피하려는 투자자들에게 매력적인 가치 기회라고 본다.
✅ 통신·필수소비재 비중 확대 검토: 골드만삭스는 통신과 필수소비재에 비중 확대를 권고한다.
✅ 호르무즈 해협 동향 주시: 두 시나리오의 분기점은 거의 전적으로 호르무즈 해협이 완전하고 지속적으로 재개방되느냐 여부에 달려 있다.
✅ ECB 통화정책회의 일정 달력에 반드시 표시
✅ 유럽 대비 미국 성장 디커플링 지속 여부 모니터링: 알리안츠 기준선에서 미국은 +2.1% 성장을 유지하는 반면 유로존은 +0.8%에 그칠 것으로 보이며 재정 적자도 각각 GDP의 -7%, -3%를 유지할 전망이다.
❓ FAQ – 댓글로 꼭 물어볼 것 같은 질문 3가지
Q1. 스태그플레이션이 오면 주식은 무조건 팔아야 하나요?
무조건 팔라는 게 아니다. 섹터 로테이션이 정답이다. 에너지, 가치주, 방어주가 성장주와 경기순환주를 앞서는 스태그플레이션 플레이북과 유사한 섹터 로테이션이 이미 시작되고 있다. 성장주·소비재 비중을 줄이고 에너지·방어주·필수소비재로 옮기는 전략이 현실적이다. 단, 시장 전체가 -1%씩 까이는 환경임을 잊지 말 것.
Q2. 한국 경제는 유럽 스태그플레이션의 영향을 얼마나 받나요?
직접 영향보다 간접 영향이 크다. 주요 에너지 수송 항로가 봉쇄되면 물가 상승과 물류비 급등이 전 세계 교역과 금융시장을 위축시킬 위험이 있다. 한국은 수출 의존도가 높고, 에너지 수입국이라 유가 급등 시 국내 물가·기업 원가에도 직격탄이다. 특히 자동차, 화학, 철강 수출 기업들의 마진 압박을 눈여겨봐야 한다.
Q3. 유럽 스태그플레이션이 ‘확정’된 것인가요, 아직 ‘가능성’인가요?
솔직히 말하면, 현재는 ‘기본 시나리오’로 격상된 ‘리스크’다. 골드만삭스는 스태그플레이션을 기본 시나리오로 단정하지는 않았지만, “리스크 균형이 악화되었고 스태그플레이션 결과의 가능성이 증가했다”고 지적했다. 하지만 EU 경제위원 발디스 돔브로프스키스가 공식 경고한 스태그플레이션 쇼크는 이미 반영되기 시작했다는 점에서, 이를 단순한 ‘꼬리 리스크’로 보기 어렵다. 에너지 가격 추이가 향후 4~8주 안에 방향을 결정할 가능성이 크다.
결론: 2026년 유럽 경제, 별점은 몇 점?
객관적으로 매긴다면 ⭐⭐☆☆☆ (5점 만점에 2점). 성장은 없고 물가는 오르고 정책은 막혀 있다. 전형적인 ‘잃어버린 시간’의 시작일 수 있다. 2022년 에너지 위기 때도 사람들은 “이번엔 다를 거야”라고 했다. 근데 달라진 게 없었다. 이번도 마찬가지일 가능성이 높다.
에디터 코멘트 : 유럽 경제에 대한 낙관론은 지금 당장 서랍에 넣어두는 게 맞다. ‘분산 투자’ 명목으로 유럽 ETF 잔뜩 담고 있다면, 섹터 구성부터 다시 뜯어봐라. 에너지·방위·필수소비재가 아닌 성장주 중심이라면, 지금이 구성 재편의 적기다. 시장이 본격적으로 스태그플레이션을 ‘가격에 반영’하기 시작하면 그때는 이미 늦다.
A colleague of mine — a sharp, no-nonsense portfolio manager who’s been in the game for nearly two decades — called me late one evening earlier this year. He’d just watched his bond allocation take a quiet, grinding hit while his grocery bill somehow kept climbing. “I feel like I’m doing everything right,” he said, “and still losing ground.” Sound familiar? That phone call sent me down a rabbit hole I hadn’t visited in a while: the world of commodity investing as a global inflation hedge. And what I found in 2026 is nothing short of fascinating — and urgent.
If you’re holding cash or traditional bonds while inflation quietly nibbles at your purchasing power, this guide is for you. Let’s walk through the data, the strategies, and the real assets that have historically (and right now, actively) punched back against rising prices.
Why Commodities Are the Inflation Fighter You Might Be Ignoring
Inflation is an economic condition that erodes the purchasing power of money, leading to higher prices across the economy. As inflation increases, many investors look for ways to protect their wealth — and commodities have long been considered a hedge against inflation due to their tangible nature and intrinsic value.
Here’s the hard data that should make every investor sit up straight: a 1 percentage point surprise increase in US inflation has, on average, led to a real (inflation-adjusted) return gain of 7 percentage points for commodities, while that same trigger caused stocks and bonds to decline 3 and 4 percentage points, respectively, according to Goldman Sachs Research. That asymmetry is the entire argument for commodities in a single sentence.
And it gets more compelling. During any 12-month period when both stocks and bonds had negative real returns, either commodities or gold delivered positive performance, according to Goldman Sachs Research. That’s not a coincidence — it’s a structural relationship.
The 2026 Commodity Landscape: What the Numbers Are Telling Us Right Now
Let’s not talk theory in a vacuum. The commodity market in 2026 is a live, volatile story. Gold rose more than 1% on Tuesday, recovering from a near one-week low, as hopes of a resolution to geopolitical tensions weighed on the dollar and eased inflation concerns. Spot gold was up 1.1% at $4,788.76 per ounce. That’s not a typo — gold is trading in the $4,700–$4,800 range as of mid-April 2026.
From 2024 through early 2026, gold prices have surged to new highs, driven by a mix of geopolitical uncertainty, record investment demand, and substantial buying from emerging market central banks. This trend underscores gold’s enduring role as a safe haven during times of economic uncertainty and its appeal as a hedge against systemic risks and inflation.
Silver is equally compelling. Silver is stepping into 2026 with completely different energy. After breaking above $55 at the end of 2025 and holding the $50–$54 zone as a real base, the metal has shifted from “the forgotten asset” to one of the most powerful stories in commodities, with year-to-date gains near 120%, having not just outperformed gold but rewritten the narrative after almost a decade of lagging.
After breaking above resistance following a 120% surge in 2025, silver has entered price-discovery territory, with a fifth consecutive year of structural supply deficit and accelerating industrial demand supporting targets beyond $65.
The Four Commodity Categories You Need to Know
Not all commodities hedge inflation equally. Goldman Sachs Research breaks this down clearly by category:
⚡ Energy (Oil & Natural Gas): Historically, energy has generated the strongest real returns across assets when inflation surprised to the upside — because energy typically responds to both supply and demand shocks. While refined oil products remain the most important commodity for global consumer prices, recent episodes have shown that natural gas has significant inflation-hedging benefits as well.
🥇 Precious Metals (Gold & Silver): Gold’s appeal lies in its scarcity and independence from any single government or currency. During periods of high inflation or monetary instability, investors often turn to gold as a hedge against currency devaluation. Meanwhile, silver is often used in industrial applications such as electronics and solar panels, providing additional demand beyond its role as a store of value — a demand that contributes to price growth, particularly during economic expansion and inflation, making silver a solid alternative for those seeking a more affordable precious metal to hedge against inflation.
🏗️ Industrial Metals (Copper, Platinum): Given their large exposure to cyclical manufacturing and the housing sector, industrial metals have demonstrated they could offer protection against demand-led inflation, generating especially high returns — averaging total real returns of 30% — late in the cycle when economy-wide inflation risks are the largest. Copper specifically: copper is widely used in construction, electronics, and infrastructure development. As the demand for copper rises, especially in emerging markets and green energy projects, the price of copper tends to increase as well.
🌾 Agriculture (Wheat, Corn, Coffee): Agricultural commodities such as wheat, corn, soybeans, and coffee tend to rise in price during inflationary times, especially when supply chain disruptions or weather-related issues affect global crops. A shortage in production, combined with rising demand, often leads to higher prices for agricultural commodities.
Real-World Case Studies: Who Got This Right?
Let’s talk about what institutions and data sources are actually saying and doing in 2026:
Goldman Sachs Research has been vocal: to protect portfolios of stocks and bonds against unexpected tail risks, investors should consider diversifying through gold as well as a range of other commodities. Equity-bond portfolios aren’t well protected against stagnant economic growth and elevated inflation — particularly when global policy uncertainty is elevated or when the economy is hit by a supply shock.
UBS Global Wealth Management has taken a clear stance: they see gold as the preferred hedge asset at this stage for its diversification potential. Trading at above $4,630/oz, gold has risen over 7% this year following a near 65% gain in 2025. Despite the strong rally, UBS expects gold prices to move higher, seeing bullion reaching $5,000/oz in coming months amid hedging demand stemming from ongoing macroeconomic, policy, and geopolitical concerns.
VanEck’s Gold Investment Outlook adds hard performance data: over the past year, gold has delivered an annualized return of roughly 65% — nearly four times the return of U.S. stocks and more than eight times that of U.S. bonds. Over two and three years, gold’s annualized returns of approximately 45% and 33%, respectively, have roughly doubled those of U.S. equities.
Bloomberg’s Commodity Outlook flags a structural theme worth watching: tight supply balances for industrial metals and a pickup in economic growth after tariffs have been digested could be the forces behind industrial metals increasing in value versus precious metals in 2026.
Morningstar offers a nuanced counterpoint worth knowing: commodities were more consistent as an inflation hedge — outpacing inflation in all five historical periods studied, while gold fell behind in two of the five periods. In other words, don’t put all your eggs in the gold basket; a broader commodity basket often outperforms.
How to Actually Invest: Your Practical Toolkit
You don’t need to store gold bars in a vault or trade crude oil futures on a commodities exchange. Here are the most accessible ways to build a commodity inflation hedge in 2026:
Commodity ETFs (Broad Exposure): You can invest in commodities through ETFs like $DBC (broad commodity exposure) or $PDBC (actively managed). These funds track prices of energy, metals, and agriculture without requiring futures contracts. For more targeted exposure, consider sector-specific ETFs (e.g., energy or agriculture) or stocks of commodity-producing companies.
Metals & Mining ETFs: The SPDR S&P Metals & Mining ETF (XME) gained 13% during the highly inflationary environment of 2022, versus a negative 18% total return for the S&P 500.
Physical Gold: For investors who value independence and liquidity, owning physical gold is a powerful way to hedge against inflation — it’s a hard asset you can hold in your hand, free from digital or institutional control.
TIPS (Treasury Inflation-Protected Securities): Inflation-linked bonds such as Treasury Inflation-Protected Securities in the United States are specifically designed to protect investors from inflation, with their principal value adjusting with changes in the consumer price index, ensuring that returns maintain real purchasing power.
Natural Gas Plays: Recent NGI trends position natural gas as a relative winner in the commodity space for 2026, with export terminals on the Gulf Coast running full capacity to send American gas across the ocean.
Platinum & Palladium: Beyond jewelry, platinum is crucial for the hydrogen economy and catalytic converters in hybrid vehicles. As the world hedges its bets between pure EVs and hybrids, platinum demand finds new support.
The Risk Management Layer: What You Must Not Ignore
A cool-headed investor always looks at both sides of the ledger. Here’s the honest risk picture:
Commodities can be volatile and do not generate income. Their prices are influenced by global demand, technological changes, and geopolitical events. This makes them better suited as a portion of a diversified portfolio rather than a standalone strategy.
The April 2026 market snapshot is a perfect teaching moment: as of April 14, 2026, the intensifying military blockade in the Strait of Hormuz sent crude oil prices soaring past triple digits, effectively eliminating market hopes for interest rate cuts and forcing a massive liquidation in the precious metals sector, with SPDR Gold Shares (GLD) and the iShares Silver Trust (SLV) recording their largest multi-day outflows in years as investors fled toward the US Dollar. Even “safe haven” trades aren’t risk-free in the short term.
The smart play? Investors should determine their risk tolerance and investment horizon to develop a balanced portfolio that includes commodities, TIPS, and alternatives like precious metals. Combining traditional investments such as stocks and bonds with alternative assets can create a robust inflation hedge portfolio — an approach that enhances exposure to diverse investment opportunities, potentially improving overall returns while mitigating the impact of inflation on purchasing power.
And don’t forget to rebalance: regularly rebalancing a portfolio ensures that it remains aligned with an investor’s goals and risk tolerance. As inflation and market conditions change, adjustments may be necessary to maintain the desired asset allocation, ensuring the portfolio continues to provide effective inflation protection.
The Rare Earth & Industrial Metal Wild Card for 2026
Here’s the angle most retail investors completely miss. Industrial metals and rare earth minerals’ direct weight in the inflation basket has been rising as the energy mix shifts from fossil fuels to renewables. Industrial metals and rare earths stand out because refining is highly concentrated in China — meaning even with only an indirect impact on inflation, such as the cost of electric vehicle batteries, a disruption could have an outsized effect.
Analysts at Goldman have named industrial metals and rare earth minerals amongst the commodities which may afford protection to your portfolio and help insulate your wealth from inflation. This is the frontier play — higher risk, but potentially asymmetric upside in a world of supply chain fragmentation.
Editor’s Comment : If you’re feeling the pinch of inflation in 2026 — and almost every investor is — the instinct to “do something” is correct. But that “something” doesn’t have to be a dramatic overhaul. Start with a 5–10% allocation to a broad commodity ETF like DBC or PDBC, consider layering in a gold position (physical or via GLD) as a geopolitical shock absorber, and look at copper-focused plays as your long-term green energy bet. You don’t have to pick a single winner. The data from Goldman, UBS, Morningstar, and Bloomberg all point to the same core truth: a diversified basket of hard assets, rebalanced with discipline, is the most reliable armor against inflation’s slow erosion of your wealth. The market in April 2026 is noisy and volatile — but that volatility itself is the argument for holding real assets, not running from them.