얼마 전 지인이 이런 말을 꺼냈어요. “요즘 수출 관련 일 하는데, 중국 바이어들이 갑자기 발주를 줄이기 시작했어. 뭔가 분위기가 이상해.” 단순한 거래처 문제가 아닐 수 있다는 생각이 들었습니다. 중국의 경제 성장률 둔화가 단순히 ‘그 나라 이야기’가 아니라, 우리의 비즈니스, 소비, 심지어 투자 포트폴리오까지 조용히 흔들고 있다는 걸 체감하는 분들이 점점 늘고 있는 것 같아요.
2026년 현재, 중국 경제는 구조적 전환점에 서 있다고 봅니다. 고도성장 시대가 저물고 ‘중속 성장’이 뉴노멀로 자리 잡는 과정에서 파급 효과는 이미 글로벌 공급망 전체로 번지고 있어요. 함께 숫자를 들여다보고, 우리가 어떻게 대응할 수 있을지 고민해 볼게요.
📊 숫자로 읽는 중국 경제 둔화의 현주소
중국의 GDP 성장률은 2010년대 초반 연 10% 안팎을 기록하던 황금기를 지나, 2023년 5.2%, 2024년 4.9%, 2025년에는 4.5% 수준으로 점차 낮아지는 추세를 보였습니다. 2026년 IMF 및 세계은행의 전망치는 4.2~4.4% 구간으로 제시되고 있어요. 숫자만 보면 ‘그래도 4%대면 양호한 거 아닌가?’라고 생각할 수 있지만, 문제는 성장의 질과 구조에 있다고 봅니다.
부동산 침체 지속: 헝다(恒大), 비구이위안(碧桂園) 사태 이후 중국 부동산 투자는 2025년 기준 전년 대비 약 8% 감소했고, 부동산이 GDP에서 차지하는 비중(직간접 포함 약 25~30%)을 고려하면 경기 전반에 미치는 하방 압력이 상당합니다.
소비 심리 위축: 청년 실업률은 2026년 1분기 기준 여전히 15% 내외 수준을 오가고 있어, 내수 소비 회복이 더딘 상황이에요.
디플레이션 압력: 중국의 소비자물가지수(CPI)는 2025년 하반기부터 소폭의 마이너스 또는 0% 부근에서 등락하며 디플레이션 우려를 키우고 있습니다.
수출 둔화: 미중 무역 갈등과 글로벌 수요 감소가 맞물리며 중국의 수출 증가율도 한 자릿수 초반대로 떨어진 상태입니다.
🌏 한국과 세계 경제에 번지는 파급 효과
중국은 한국의 최대 교역국입니다. 한국 전체 수출에서 중국이 차지하는 비중은 여전히 약 20% 내외를 유지하고 있어요. 중국의 제조업 경기가 위축되면, 한국의 반도체·석유화학·철강 수출이 직격탄을 맞는 구조입니다.
실제로 2025년 한국의 대중(對中) 수출은 전년 대비 소폭 감소했고, 특히 중간재·소재 분야에서 타격이 컸습니다. 이는 단순한 경기 사이클 문제가 아니라, 중국이 자국 내 소재·부품 자급률을 높이는 ‘공급망 내재화 전략’을 가속화하고 있기 때문이기도 해요. 우리 기업 입장에서는 ‘시장 축소’와 ‘경쟁 심화’가 동시에 닥치는 이중고인 셈이죠.
동남아시아, 특히 베트남·인도네시아 등은 중국에서 이탈한 글로벌 제조 투자를 흡수하며 반사이익을 누리는 모습입니다. 애플, 삼성 등 주요 제조사들이 생산 기지를 인도·베트남으로 분산한 것은 이미 잘 알려진 사례고요. 이른바 ‘차이나 플러스 원(China+1)’ 전략이 2026년 현재 본격화 단계에 들어선 것으로 보입니다.
💡 투자자·소비자·사업자를 위한 현실적 대안
그렇다면 우리는 어떻게 대응해야 할까요? 막연한 불안감보다는, 상황을 정확히 읽고 포지션을 조정하는 것이 현명한 접근이라고 봅니다.
투자자라면: 중국 직접 투자 비중을 줄이고, 중국 수요 의존도가 낮은 인도·아세안 ETF나 미국 내수 소비 섹터로 분산을 고려해 볼 만합니다. 물론 분산 자체가 만능은 아니니, 자신의 리스크 허용 범위를 먼저 점검하는 게 우선이에요.
수출 중소기업이라면: 중동·동남아·남미 등 신흥 시장으로 거래처 다변화를 서두르는 것이 중장기 생존 전략이 될 수 있습니다. KOTRA 등 공공 기관의 시장 개척 지원 사업을 적극 활용해 보세요.
소비자 입장에서는: 중국산 원자재 비중이 높은 제품군(배터리, 전자제품 부품 등)의 가격 변동성에 주목할 필요가 있어요. 중국 내 생산 비용 구조 변화가 최종 소비재 가격에 반영되는 데는 통상 6~12개월의 시차가 존재합니다.
공통적으로: 달러 자산 또는 금(Gold)과 같은 안전 자산의 비중을 일정 수준 유지하는 것이 글로벌 불확실성 헤지(hedge) 수단으로 여전히 유효하다고 봅니다.
중국 경제 둔화는 위기이기도 하지만, 동시에 공급망 재편과 신시장 개척이라는 기회의 창이 열리는 시기이기도 합니다. 변화의 방향을 먼저 읽는 쪽이 결국 유리한 포지션을 차지하게 되는 것 같아요.
에디터 코멘트 : 중국 경제 이슈는 너무 거시적으로 느껴져서 ‘나랑 무슨 상관이야’라고 넘기기 쉬운데, 사실 우리 밥상 물가부터 취업 시장까지 연결 고리가 생각보다 촘촘합니다. 당장 거창한 포트폴리오 재편이 어렵다면, 내가 관여된 산업이 중국 수요와 얼마나 연동되어 있는지 한 번쯤 체크해 보는 것만으로도 충분한 시작이라고 봐요. 아는 것과 모르는 것의 차이가, 변화 앞에서 당황하느냐 준비하느냐를 가르는 첫 번째 분기점이니까요.
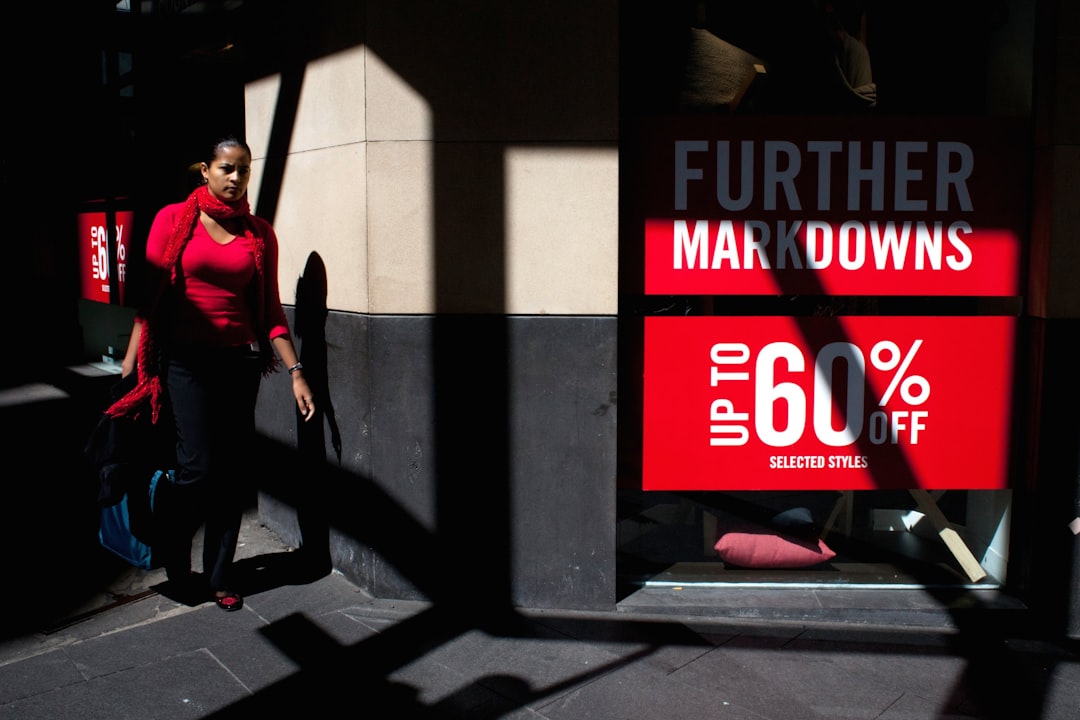
Picture this: It’s early 2026, and you’re standing in a grocery store noticing that the price tags on your usual items haven’t jumped dramatically compared to last year. There’s a quiet sense of relief — but also a strange hesitation at the checkout. You still reach for the store-brand pasta instead of the premium one. Old habits, right? This micro-moment is playing out in millions of households worldwide, and it’s telling us something profound about the post-inflation consumer psyche that pure economic data simply can’t capture.
Yes, inflation is slowing down in 2026. But that doesn’t mean consumers are rushing back to their pre-inflation spending habits. Let’s think through this together — because the story is far more nuanced, and frankly, more fascinating than the headlines suggest.
📊 The Numbers: What “Cooling Inflation” Actually Looks Like in 2026
To set the stage, let’s look at where we actually stand. In the United States, the Consumer Price Index (CPI) growth rate has decelerated to approximately 2.4% year-over-year as of Q1 2026 — meaningfully closer to the Federal Reserve’s 2% target than the painful peaks of 8–9% we saw back in 2022. The Eurozone is seeing similar normalization, with headline inflation hovering around 2.1–2.6% across major economies. South Korea’s Statistics Korea reported a CPI increase of roughly 2.3% year-on-year in early 2026, a dramatic contrast from the 5–6% surges experienced in 2022–2023.
On paper, this sounds like the storm has passed. But here’s where it gets interesting: price levels haven’t fallen — they’ve just stopped rising as fast. That distinction is enormous for real household budgets. A family that was spending $800/month on groceries in 2020 might now be spending $1,100–$1,200, even with “cooling” inflation. The cumulative price damage is still very much baked in.
Core services inflation (rent, healthcare, education) remains stickier than goods inflation in most developed markets.
Wage growth in the U.S. is running at approximately 3.8% year-over-year in early 2026 — technically outpacing inflation, but not enough to erase 3 years of accumulated price increases for many workers.
Consumer confidence indices (e.g., Conference Board, University of Michigan) show cautious optimism but not euphoria — people feel slightly better, not fundamentally healed.
Personal savings rates in the U.S. remain relatively low at around 3.5–4%, suggesting consumers are still stretched despite slowing inflation.
Credit card delinquency rates have ticked up compared to 2023 levels, particularly in the 25–40 age bracket, pointing to ongoing financial stress beneath the surface.
🛒 The “Inflation Scar” Effect: Why Consumers Aren’t Bouncing Back Immediately
Behavioral economists have a term worth knowing here: loss aversion. Research consistently shows that people feel the pain of a financial loss roughly twice as intensely as the pleasure of an equivalent gain. When consumers endured 2–3 years of price shocks, it didn’t just drain wallets — it rewired spending psychology. In 2026, even as price pressures ease, many shoppers have internalized frugality as a new identity, not just a temporary survival strategy.
A fascinating data point: McKinsey’s 2026 Global Consumer Sentiment Report found that approximately 62% of surveyed consumers across 15 markets said they planned to continue trading down to lower-cost alternatives in at least one major spending category, even though they acknowledged that their financial situation had improved slightly. This is what I call the “inflation scar” — and it’s reshaping entire consumer markets.
🌍 International Examples: How Different Markets Are Responding
United States — The Bifurcated Consumer Economy: The U.S. is experiencing what analysts are calling a “K-shaped recovery” in consumer spending. High-income households (top 20% by income) are spending robustly on travel, luxury goods, and experiences — the premium segment of the leisure and hospitality market is actually booming. Meanwhile, middle- and lower-income households remain deeply value-conscious, driving record-level growth for discount retailers like Walmart, Aldi, and Dollar General even into 2026. This bifurcation is one of the defining commercial stories of the year.
South Korea — The “Resale Economy” Surge: South Korean consumers, particularly Gen Z and younger Millennials, have dramatically accelerated adoption of second-hand and resale platforms like Karrot (당근마켓) and Bunjang (번개장터). These platforms reported combined GMV (Gross Merchandise Value) increases of over 30% year-on-year in 2025, a trend that has carried strongly into early 2026. Korean consumers have become exceptionally adept at finding value without sacrificing lifestyle quality — a behavioral shift that major Korean retailers like Lotte and Shinsegae are scrambling to adapt to.
Germany & the EU — Experiences Over Things: Germany, which went through a particularly acute energy-price crisis in 2022–2023, is showing a strong consumer pivot toward spending on experiences — domestic travel, cultural events, dining — rather than durable goods. German retail sales data for goods remain sluggish even in 2026, while the hospitality and tourism sectors show clear recovery momentum. This aligns with a broader European trend of “conscious consumption” that prioritizes meaning over material accumulation.
🏪 How Industries Are Adapting — and Which Ones Are Winning
The consumer market isn’t passively waiting for old spending patterns to return. Smart companies have been actively engineering for the post-inflation consumer, and the strategies are worth studying:
Private label dominance: Supermarkets globally have aggressively expanded store-brand product lines. In the UK, retailer Tesco now derives over 55% of grocery revenue from own-brand products as of 2026 — a historic milestone. Consumers who switched to store brands during peak inflation have largely stayed, even as name-brands launched counter-campaigns.
Subscription model fatigue and restructuring: The pandemic-era subscription boom is being followed by a rationalization phase. Many consumers are canceling or pausing non-essential subscriptions — streaming services, meal kits, beauty boxes — creating openings for “pay-per-use” or “flexible plan” models that reduce commitment anxiety.
The “affordable luxury” middle market: Brands positioned just above mass-market but clearly below true luxury are seeing outsized growth. Think accessible athleisure, mid-tier specialty coffee brands, and quality-forward skincare at non-luxury price points. Consumers want to feel they’re treating themselves without true luxury price tags.
AI-powered personalized discounting: Retailers like Amazon, Target, and emerging Asian e-commerce platforms are deploying AI to offer hyper-personalized discount and loyalty offers. Rather than broad markdowns, they’re targeting individual price-sensitivity thresholds — a major leap from traditional coupon marketing.
Health & wellness resilience: Despite tighter budgets, spending on health, fitness, and mental wellness has remained notably resilient across demographics in 2026. Consumers appear to view health spending as non-negotiable, even when cutting back elsewhere — a significant shift from pre-pandemic attitudes.
🔮 What This Means for Everyday Consumers: Realistic Alternatives Going Forward
Okay, so where does this leave you as an individual navigating this environment? Let me offer some practical, grounded perspectives rather than generic financial advice:
If you’re feeling like your budget still feels tight even though inflation is “officially” cooling, you’re not imagining it — and you’re not failing at personal finance. You’re experiencing the cumulative weight of multi-year price increases that haven’t reversed. The productive move isn’t guilt; it’s strategic adaptation.
Audit your subscriptions with fresh eyes every quarter. The average U.S. household still underestimates its monthly subscription spending by about $133, according to recent 2026 survey data. A quarterly review can recover real money.
Lean into the resale and circular economy. Platforms like Poshmark, Vinted, eBay, and local equivalents aren’t just for bargain hunters anymore — they’re smart, mainstream choices used by millions of financially savvy consumers.
Reframe “trading down” as “trading smart.” Choosing a store-brand product or a less-known alternative that performs equivalently isn’t a compromise of your lifestyle — it’s intelligent resource allocation that frees budget for things that genuinely matter to you.
Prioritize experiences that build memories over goods that depreciate. The data on happiness economics is consistent: experiences generate more lasting satisfaction than equivalent-cost material purchases. This aligns beautifully with where consumer culture seems to be naturally heading in 2026.
Watch for “shrinkflation reversals.” Some brands that secretly shrank package sizes during peak inflation are quietly restoring them to original sizes as competitive pressure mounts. It pays to notice and reward brands that treat you honestly.
The broader point? The 2026 consumer landscape is genuinely different from 2019 — and that’s not entirely a bad thing. The inflation shock, for all its hardship, accelerated some genuinely positive behavioral shifts: more value-consciousness, less thoughtless consumption, greater appreciation for experiences over things, and a boom in circular economy participation.
The smart move — whether you’re a consumer, a small business owner, or someone planning a major purchase — is to stop waiting for a return to pre-2022 “normal” and start designing your financial life around the reality of 2026. Because honestly? This is the new normal, and it has its own kind of opportunity baked right in.
Editor’s Comment : What strikes me most about this moment is how consumer behavior is running about 12–18 months behind the macroeconomic data. Inflation has technically cooled, but the psychological and behavioral patterns forged during those brutal price-surge years are still very much driving decisions in 2026. For anyone feeling that disconnect between the good economic headlines and their personal financial reality — trust your lived experience. The numbers are getting better, but healing consumer confidence is a slower, more human process than any central bank model fully captures. And that’s perfectly okay.
얼마 전 지인과 대화를 나누다 흥미로운 말을 들었어요. “물가가 좀 잡혔다는데, 근데 나는 왜 아직도 장보기가 무섭지?” 라고요. 맞아요. 인플레이션이 둔화됐다는 뉴스는 들리는데, 막상 일상에서 체감하기까지는 시차가 있거든요. 2026년 현재, 주요국 소비자물가지수(CPI) 상승률이 확연히 꺾이면서 ‘포스트 인플레이션’ 국면으로 접어들고 있다는 분석이 많아지고 있어요. 그런데 흥미로운 건 물가가 안정된다고 해서 소비 패턴이 예전으로 단순히 되돌아가지 않는다는 거예요. 오히려 소비자들은 더 영리하고, 더 선택적으로 바뀌었어요. 오늘은 이 변화를 함께 짚어보려 합니다.
📊 숫자로 보는 2026년 인플레이션 둔화 현황
2022~2023년 전 세계를 강타했던 고인플레이션 파고는 2024년부터 본격적으로 둔화되기 시작했고, 2026년 현재는 상당 부분 안정권에 진입했다고 볼 수 있어요. 몇 가지 주요 수치를 살펴볼게요.
한국 소비자물가 상승률: 2026년 1분기 기준 약 1.8% 내외로 한국은행 목표치(2%)에 근접하거나 하회하는 수준으로 안정됐어요.
미국 CPI: 2025년 말~2026년 초 기준 2%대 초반으로 수렴하며 연준(Fed)의 금리 인하 기조 강화에 힘을 실어주고 있어요.
유럽연합(EU): 에너지 가격 안정화와 공급망 회복에 힘입어 HICP(조화소비자물가지수) 상승률이 2% 전후로 내려앉았어요.
식료품·에너지 제외 근원 물가(Core CPI): 국내 기준 2%대 초중반 수준으로, 완전한 안정보다는 ‘점진적 정상화’라는 표현이 더 정확한 것 같아요.
수치만 보면 안도감이 드는 건 사실이에요. 하지만 중요한 포인트는 물가 수준(Level) 자체는 2020년 이전보다 여전히 20~25% 높은 상태라는 거예요. 상승 속도가 둔화됐을 뿐, 가격이 내려간 게 아니라는 거죠. 이 미묘한 차이가 소비자 심리와 행동 변화의 핵심 배경이 된다고 봅니다.
🌍 국내외 사례로 보는 소비 패턴의 실질적 변화
인플레이션 둔화 이후 소비 시장이 어떻게 바뀌는지, 국내외 사례를 통해 살펴볼게요.
🇰🇷 국내 — 가성비에서 ‘가심비’와 ‘선택적 프리미엄’으로
2023~2024년 극단적 가성비 소비, 일명 ‘짠테크’가 유행했다면, 2026년에는 조금 다른 흐름이 보여요. 이마트·롯데마트 등 대형마트의 PB(Private Brand) 상품 매출 비중은 여전히 높지만, 동시에 특정 카테고리—예를 들어 건강기능식품, 홈뷰티 기기, 프리미엄 간편식—에서는 오히려 객단가가 올라가고 있어요. ‘아낄 건 아끼고, 의미 있는 곳엔 쓴다’는 양극화된 소비 전략이 확산되고 있다는 거죠.
🇺🇸 미국 — ‘리벤지 소비’의 피로감과 경험 소비의 재편
팬데믹 이후 폭발적으로 늘었던 리벤지 소비(보복 소비)의 열기가 2025년을 기점으로 눈에 띄게 식었어요. 대신 미국 소비자들은 ‘소유보다 경험’이라는 방향성은 유지하되, 가격 대비 경험의 질을 훨씬 꼼꼼히 따지기 시작했어요. 항공사들이 비즈니스석 수요 둔화를 보고하는 한편, 중거리 여행과 로컬 여행 관련 소비는 오히려 늘고 있는 것도 같은 맥락이라 할 수 있어요.
🇯🇵 일본 — 디플레이션 탈출 후 소비자의 혼란
일본은 조금 특수한 케이스예요. 수십 년간 이어진 디플레이션에서 벗어나 인플레이션을 경험하고, 다시 물가가 안정되는 국면을 맞이하면서 소비자 심리가 상당히 복잡하게 얽혀 있어요. ‘이제 가격이 오를 수 있다’는 학습 효과가 생기면서, 오히려 필수재 비축 소비와 선구매 패턴이 새로운 트렌드로 자리 잡고 있다는 점이 흥미롭습니다.
🛒 2026년 소비 시장을 이해하는 핵심 키워드 5가지
디인플루언싱(De-influencing): SNS 인플루언서의 무분별한 소비 권장에 피로감을 느끼고, 스스로 소비를 거르는 문화가 Z세대·알파세대 중심으로 확산되고 있어요. 단순히 유행이 아니라 고인플레이션 시대를 통과하며 형성된 ‘소비 내성’이라고 볼 수 있습니다.
구독 피로(Subscription Fatigue): 넷플릭스, 유튜브 프리미엄, 각종 SaaS 구독 서비스가 난립하면서 ‘구독 정리’가 하나의 재테크가 됐어요. 2026년에는 구독 서비스 시장 자체가 재편되는 신호가 보이고 있어요.
하이퍼 로컬 소비: 글로벌 공급망 불안의 학습 효과로, 지역 생산 농산물·로컬 브랜드에 대한 신뢰와 선호도가 높아지고 있어요.
중고·순환 경제의 주류화: 당근마켓, 번개장터 같은 중고 플랫폼이 ‘없는 사람들의 것’이라는 인식에서 완전히 벗어나 라이프스타일의 한 축으로 자리 잡았어요.
웰니스 지출 방어: 경기가 불안할수록, 또 물가가 안정되는 국면에서도 건강·운동·멘탈 케어 관련 지출은 가장 마지막까지 줄이지 않는 ‘방어적 프리미엄’ 영역으로 부상하고 있습니다.
💡 현실적 대안 — 인플레이션 둔화 시대, 소비를 어떻게 재설계할까
물가가 안정됐다는 신호가 왔을 때, 무조건 허리띠를 풀기보다는 ‘소비 포트폴리오’를 재점검해보는 시기로 활용하는 게 좋을 것 같아요. 몇 가지 실천 가능한 제안을 드려볼게요.
소비 카테고리별 민감도 체크: 내가 어떤 항목에서 ‘물가 둔화’를 체감하는지, 반대로 여전히 비싸게 느끼는 항목은 어디인지 기록해보는 것만으로도 불필요한 지출을 줄이는 데 도움이 돼요.
구독 서비스 반기별 감사(Audit): 6개월에 한 번씩 구독 목록을 전부 꺼내놓고, 실제 이용 빈도와 체감 가치를 비교해보세요. 체감 낭비 비용이 꽤 클 수 있어요.
선택적 프리미엄 전략 적용: ‘모든 걸 싸게’가 아니라 ‘의미 있는 소비에 집중’하는 방식으로 심리적 만족도와 실질 절약을 동시에 잡을 수 있어요.
금리 인하 흐름 활용: 인플레이션 둔화는 보통 금리 인하 사이클과 맞닿아 있어요. 고금리 때 묶어뒀던 자금 운용 전략을 재검토해볼 타이밍이라고 봐요.
에디터 코멘트 : 인플레이션 둔화가 ‘끝났다’는 신호가 아니라 ‘전환점’이라는 시각이 중요한 것 같아요. 소비자로서 우리는 고물가 시대를 통과하며 꽤 단단해졌거든요. 그 단단함을 유지하면서, 이제는 조금 더 자신의 가치관에 맞는 방향으로 소비를 재조율해가는 것—그게 2026년 가장 현명한 라이프스타일 전략이 아닐까 싶습니다. 아무쪼록 숫자 뒤에 숨어 있는 내 삶의 맥락을 놓치지 않으셨으면 해요.
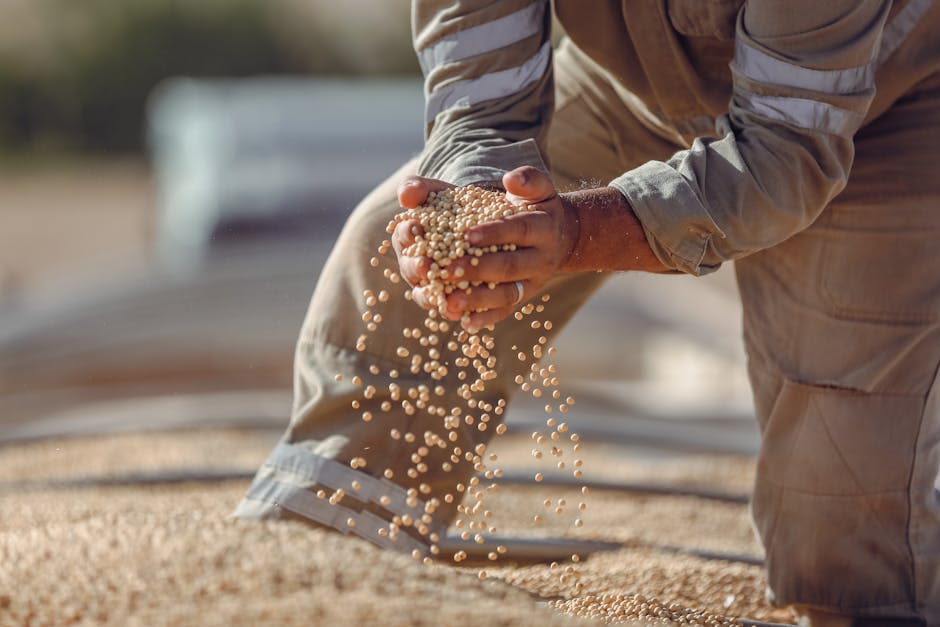
Picture this: It’s early 2026, and a mid-sized hedge fund manager in Chicago is staring at his screen, watching soybean futures swing wildly after an unexpected frost report swept through Brazil’s Mato Grosso region. Within 48 hours, his unhedged position has lost 12% of its value. Sound dramatic? It happens more often than you’d think — and it’s exactly why agricultural commodity investment risk management deserves a serious, nuanced conversation.
Agricultural commodities — think wheat, corn, soybeans, coffee, sugar, and cocoa — have always been attractive to investors seeking portfolio diversification. But unlike gold or crude oil, agri-commodities carry a uniquely layered set of risks that blend meteorological unpredictability, geopolitical tension, supply chain fragility, and biological factors (pests, disease) all at once. Let’s reason through this together.
Why Agricultural Commodities Are Uniquely Risky in 2026
The global agricultural commodity market in 2026 is operating under compounding pressure. According to the FAO’s early 2026 Food Price Index update, volatility in key staple commodities remains significantly elevated compared to pre-2020 baselines — driven by three converging forces:
Climate Disruption: El Niño patterns transitioning into a La Niña cycle in late 2025 have disrupted precipitation across Southeast Asia and South America, affecting rice and soybean yields respectively.
Geopolitical Supply Shocks: Trade route disruptions in the Black Sea region continue to affect global wheat supply chains, keeping market premiums unstable.
Input Cost Inflation: Fertilizer prices, particularly nitrogen-based compounds, remain elevated due to energy market pressures in Europe and supply concentration risks tied to a handful of producing nations.
Currency Volatility: Emerging market currencies — major commodity exporters like Brazil (BRL) and Argentina (ARS) — have experienced notable depreciation, which paradoxically boosts export volumes but creates price instability for importers.
Policy Uncertainty: Export bans and tariff adjustments by major producers (India on rice, Argentina on soy) continue to inject sudden, hard-to-predict price shocks into global markets.
Core Risk Categories Every Investor Should Map Out
Before we talk strategy, it’s worth building a mental map of what we’re actually managing. Agricultural commodity risks generally fall into these interconnected buckets:
Price Risk: The most obvious — commodity prices fluctuate based on supply-demand dynamics, speculation, and macroeconomic sentiment.
Weather & Climate Risk (Basis Risk): Even with futures hedges in place, localized weather events can cause the spot price to diverge significantly from your hedged position — this divergence is called “basis risk.”
Liquidity Risk: Some softs (coffee, cocoa) and niche grains have thinner futures markets, meaning large position exits can move the market against you.
Counterparty Risk: Especially relevant in OTC (over-the-counter) derivative contracts where the other party’s creditworthiness matters.
Regulatory & Policy Risk: Sudden export restrictions or subsidy changes can make previously sound positions instantly unprofitable.
Storage & Logistics Risk: Physical commodity investors face spoilage, storage cost escalation, and transport disruption risks that financial instrument investors don’t always account for.
Real-World Examples: Learning from 2025–2026 Market Events
Let’s ground this in recent reality. In late 2025, Vietnam — the world’s third-largest rice exporter — temporarily restricted rice exports citing domestic food security concerns amid drought in the Mekong Delta. Thai rice spot prices surged over 18% within three weeks. Investors holding long Thai rice futures benefited enormously, while importers without forward contracts scrambled. The lesson? Policy risk can materialize overnight, and diversified sourcing strategies matter just as much as financial hedging.
Meanwhile, in the cocoa market, the Ivory Coast and Ghana — which together account for roughly 60% of global cocoa supply — saw continued yield shortfalls in early 2026 due to the lingering effects of swollen shoot virus disease and irregular rainfall. Cocoa futures on the ICE exchange have been trading near multi-year highs. Several European chocolate manufacturers who had locked in multi-year supply contracts in 2023 are now sitting on significant competitive advantages over rivals who didn’t.
On the other side of the equation, Brazilian soybean producers who over-leveraged on BRL-denominated debt to expand acreage in 2024 are now facing margin squeezes as global prices stabilized while their input costs remain elevated. Expansion without adequate financial hedging — a classic risk management failure.
Practical Risk Management Strategies That Actually Work
Now, here’s where we get constructive. Risk management in agricultural commodities isn’t about eliminating risk — it’s about making your risk profile match your capacity and investment horizon. Here’s a tiered framework:
Diversification Across Commodity Classes: Don’t concentrate in a single crop or region. Mixing grains (wheat, corn), softs (coffee, cocoa), and oilseeds (soybeans, palm oil) reduces correlation risk.
Futures Hedging: Use exchange-traded futures (CME Group for grains, ICE for softs) to lock in prices. This is especially effective for producers and large commercial buyers. Be aware of roll costs and basis risk.
Options Strategies: Buying put options gives you downside protection while keeping upside exposure. Collar strategies (buying puts + selling calls) cap both upside and downside — ideal for risk-averse investors.
Commodity ETFs and Mutual Funds: For retail investors, diversified agriculture ETFs (tracking indices like the Bloomberg Agriculture Subindex) reduce single-commodity concentration risk without requiring futures expertise.
Weather Derivatives & Insurance: Increasingly available through specialized insurers and exchanges, weather derivatives pay out based on temperature or rainfall indices rather than crop losses — useful for producers and some institutional investors.
Supply Chain Intelligence: Investing in real-time satellite crop monitoring data and weather analytics services (like those offered by Maxar Technologies or The Climate Corporation) gives early warning signals before market prices react.
Position Sizing & Stop-Loss Discipline: Never allocate more than 5–10% of a diversified portfolio to agricultural commodities without a corresponding hedging strategy. Define your maximum drawdown tolerance before entering any position.
Realistic Alternatives for Different Investor Profiles
Here’s where I want to be honest with you: not every investor should be directly trading agricultural commodity futures. Let’s think through your options based on who you are:
If you’re a retail investor looking for inflation protection and diversification, consider agriculture-focused ETFs or shares in agri-business companies (fertilizer producers, seed companies, food processors like Archer-Daniels-Midland or Bunge). These provide indirect commodity exposure with company-level risk management already baked in.
If you’re an institutional investor or family office with a longer time horizon, farmland REITs (Real Estate Investment Trusts that own productive agricultural land) have historically delivered strong inflation-adjusted returns with lower volatility than futures markets. In 2026, this asset class continues to attract significant capital from pension funds globally.
If you’re a commodity producer or agri-business operator — a farmer, food manufacturer, or commodity trader — structured hedging programs using a combination of futures, options, and forward contracts tailored to your specific production cycle are essential. Working with a commodity risk advisor, not just a general financial planner, makes a real difference.
If you’re curious but capital-constrained, paper trading (simulated trading without real money) on platforms that track live futures prices is a genuinely useful way to develop intuition for how these markets behave before committing real capital.
The bottom line? Agricultural commodity markets in 2026 offer real opportunities — but they demand respect for their complexity. The investors who thrive here aren’t necessarily the boldest; they’re the most disciplined, the most informed, and the most honest about what they don’t know.
Editor’s Comment :Agricultural commodity investment is one of those areas where overconfidence is genuinely dangerous. The markets humble even seasoned professionals. What I find fascinating, though, is that the very complexity that makes them risky also makes them rich with opportunity for investors willing to do the homework. Start with education, keep position sizes modest, and never skip the hedging step — treat it like a seatbelt, not an optional upgrade.
얼마 전, 투자 커뮤니티에서 흥미로운 글을 하나 읽었어요. 2024년 말 코코아 선물에 올인했다가 단 3개월 만에 원금의 40%를 잃었다는 한 개인 투자자의 사연이었습니다. 그분은 ‘엘니뇨로 인한 서아프리카 작황 부진’이라는 뉴스를 보고 확신을 갖고 진입했는데, 정작 시장은 전혀 다른 방향으로 움직였다고 하더라고요. 농산물 원자재 시장이 그래서 무섭습니다. 논리는 완벽한데 결과는 처참할 수 있거든요. 2026년 현재, 기후 위기 심화와 지정학적 불안정이 맞물리면서 농산물 원자재 시장의 변동성은 그 어느 때보다 커져 있습니다. 오늘은 이 시장에 관심 있는 분들과 함께, 수익을 좇기 전에 반드시 알아야 할 리스크 관리 전략을 차근차근 살펴보려 합니다.
📊 본론 1 : 2026년 농산물 시장, 숫자로 보는 변동성의 민낯
농산물 원자재가 다른 자산군과 근본적으로 다른 이유는 가격 결정 요인의 복잡성 때문이라고 봅니다. 주식은 기업 실적이라는 비교적 추적 가능한 지표가 있지만, 밀·옥수수·대두 같은 농산물은 날씨, 병충해, 환율, 정부 수출 규제, 바이오연료 정책까지 수십 가지 변수가 가격을 뒤흔듭니다.
구체적인 수치를 살펴볼게요. 2026년 1분기 기준으로 주요 농산물의 연간 변동성(Annualized Volatility)은 다음과 같은 수준으로 관측되고 있습니다.
소프트 원자재(코코아·커피·설탕) : 평균 변동성 35~55% 구간. 2025년 하반기 서아프리카 강수 이상으로 코코아는 한때 톤당 $9,800를 돌파하는 극단적 급등 후 단기 조정을 반복하고 있어요.
S&P 500 대비 비교 : 같은 기간 미국 증시 변동성 지수(VIX)는 평균 18~22 수준. 농산물 시장의 변동성이 주식시장 대비 1.5~2.5배 높다는 걸 알 수 있습니다.
레버리지 리스크 : 농산물 선물 거래는 통상 증거금이 계약 가치의 5~10%에 불과해, 이론상 레버리지가 10~20배에 달합니다. 5% 역방향 가격 변동만으로도 증거금 전액이 날아갈 수 있는 구조예요.
이 수치들이 의미하는 바는 명확합니다. 농산물 원자재는 ‘정보가 많으면 이길 수 있는 시장’이 아니라, ‘리스크 자체를 설계해야 살아남는 시장’이라는 점입니다.
🌍 본론 2 : 국내외 사례로 배우는 리스크 관리의 성패
실패 사례 — 2025년 러시아 밀 수출 금지령 충격
2025년 3월, 러시아 정부가 자국 식량 안보를 이유로 전격적인 밀 수출 쿼터 축소 조치를 단행했습니다. CBOT 밀 선물은 발표 이틀 만에 12% 급등했는데, 문제는 이 흐름에 뒤늦게 ‘매수’ 포지션을 잡은 개인 투자자들이었어요. 이미 가격이 올라버린 상황에서 진입한 탓에, 이후 수출 재개 협상 소식이 나오자 불과 2주 만에 가격이 8% 되돌림하면서 손실이 발생했습니다. 뉴스를 보고 따라가는 ‘후행 투자’의 전형적인 리스크 사례라고 볼 수 있어요.
성공 사례 — 국내 농산물 ETF 분산 투자 전략
반면, 국내에서는 단일 품목 선물이 아닌 농산물 관련 ETF를 포트폴리오의 일부로 편입하는 방식이 주목받고 있습니다. 예를 들어, 해외 상장된 Invesco DB Agriculture Fund(DBA)나 iPath Bloomberg Agriculture Subindex ETN 등은 밀·옥수수·대두·설탕·커피 등 여러 농산물에 분산 투자하는 구조입니다. 한 품목이 급락해도 다른 품목이 헤지(Hedge) 역할을 할 수 있어, 단일 선물 대비 변동성이 30~40% 낮아지는 효과가 있다고 봅니다. 2025년 한 해 동안 DBA의 최대 낙폭(MDD, Maximum Drawdown)은 약 -14%였던 반면, 같은 기간 코코아 단일 선물의 MDD는 -38%에 달했습니다. 분산의 힘이 숫자로 증명된 셈이에요.
기관 투자자의 접근법 — 계절성 모델과 스톱로스 설계
글로벌 헤지펀드들은 농산물 투자 시 단순히 방향성(Long/Short)만 베팅하는 게 아니라, 계절성 분석(Seasonality Analysis)과 차익 스프레드 전략(Calendar Spread)을 적극 활용합니다. 예를 들어 대두는 북반구 수확기인 9~11월에 계절적 공급 증가 압력을 받는 패턴이 역사적으로 뚜렷하게 나타나는데, 이를 기반으로 진입 타이밍과 청산 규칙을 사전에 명확히 설계하는 방식이에요. 개인 투자자도 이 논리는 충분히 차용할 수 있습니다.
🛡️ 본론 3 : 개인 투자자를 위한 현실적인 리스크 관리 체크리스트
포지션 사이징(Position Sizing) 원칙 : 전체 투자 자산의 5~10% 이내로 농산물 원자재 비중을 제한하는 것이 합리적이라고 봅니다. 아무리 확신이 강해도 단일 자산군에 30% 이상 집중하는 건 리스크 관리가 아니라 도박에 가깝습니다.
스톱로스(Stop-Loss) 사전 설정 : 진입 전에 반드시 ‘이 가격이 되면 손절한다’는 기준을 정해두세요. 농산물 시장의 갑작스러운 뉴스발 급변동에 즉각 대응하려면 감정이 개입되기 전에 규칙이 있어야 합니다.
선물 직접 투자보다 ETF·ETN 우선 검토 : 선물은 만기일 롤오버(Roll-over) 비용과 레버리지 구조를 정확히 이해하지 못하면 예상치 못한 손실이 생깁니다. 초보자라면 ETF·ETN으로 먼저 시장 감각을 익히는 게 현명한 순서라고 생각해요.
기후·정책 뉴스 모니터링 루틴 구축 : NOAA(미국 해양대기청)의 엘니뇨·라니냐 예보, 미국 농무부(USDA) 월간 수급 보고서(WASDE), 주요 곡물 수출국 정부 발표 등을 정기적으로 확인하는 습관이 필요합니다.
환율 리스크 인식 : 농산물 원자재는 달러로 가격이 책정됩니다. 원화 기준 투자자라면 달러 강세 시 수익이 상쇄되거나 손실이 확대될 수 있다는 점을 항상 염두에 두어야 해요.
분산 투자로 품목 상관관계 활용 : 밀과 옥수수는 가격 상관관계가 높지만, 커피와 대두는 상관관계가 낮은 편입니다. 서로 다른 공급망을 가진 품목들을 조합하면 포트폴리오 전체 변동성을 낮출 수 있습니다.
에디터 코멘트 : 농산물 원자재 투자는 ‘알면 이기는 게임’이라기보다 ‘모르면 반드시 지는 게임’에 가깝다는 생각이 들어요. 2026년 현재 기후 변화와 지정학적 리스크가 구조적으로 심화되면서 이 시장의 기회 자체는 분명히 커지고 있습니다. 다만 그 기회는 리스크 관리 체계를 먼저 갖춘 사람에게만 열린다고 봐요. 화려한 수익 사례보다 조용히 살아남은 투자자들의 공통점에 더 주목해 보시길 권해드립니다. 원자재 시장에서 ‘살아남는 것’이 곧 ‘이기는 것’이니까요.
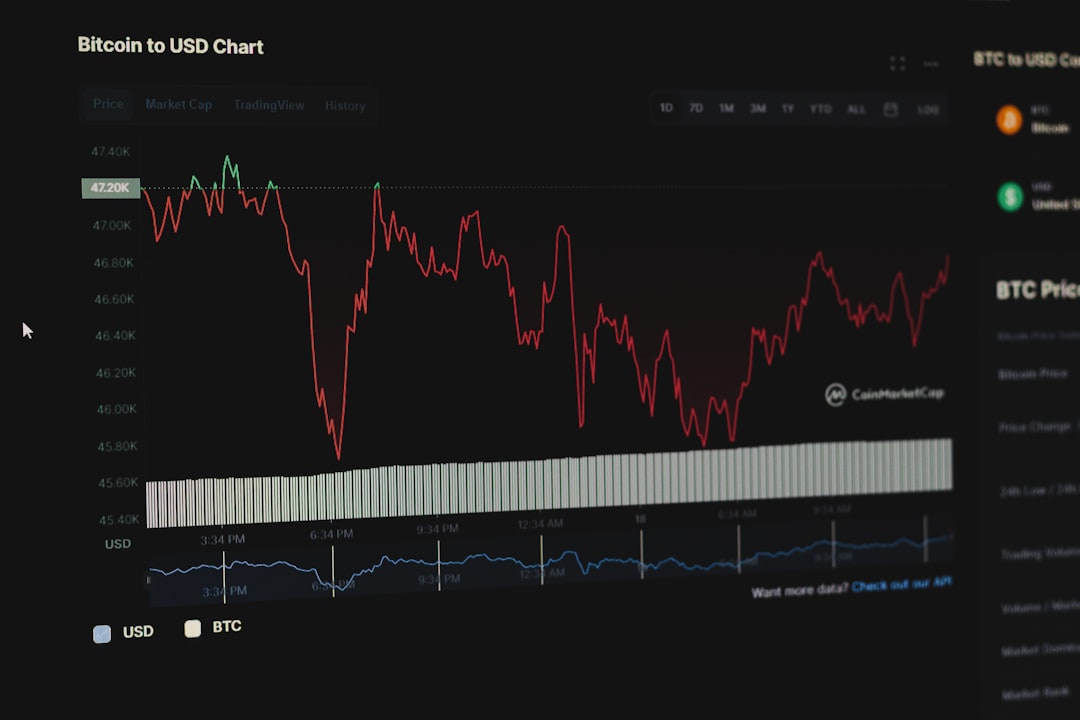
Picture this: It’s early 2026, and you’re sitting at your kitchen table, coffee in hand, scrolling through headlines about the Federal Reserve’s latest meeting. The words ‘rate cut expectations’ keep popping up, but every time you think it’s finally happening, the Fed holds steady. Sound familiar? If you’ve been playing this waiting game, you’re definitely not alone — and frankly, the suspense has been exhausting for investors, homebuyers, and everyday savers alike.
Let’s dig into what’s actually going on with the Fed’s rate cut timeline in 2026, what the data is telling us, and — most importantly — what you can realistically do about it right now.
Where Does the Fed Stand Right Now in 2026?
As of Q1 2026, the Federal Reserve has maintained a cautious, data-dependent stance. After a series of modest cuts in late 2024 and early 2025, the Fed pumped the brakes again in response to stubborn inflation in the services sector and a surprisingly resilient labor market. The federal funds rate currently sits in the 4.25%–4.50% range, still historically elevated compared to the near-zero environment we saw in the early 2020s.
Here’s what the current data picture looks like:
Core PCE Inflation (Feb 2026): Hovering around 2.6–2.8%, still above the Fed’s 2% target — but trending in the right direction, slowly.
Unemployment Rate: Approximately 4.3%, slightly above the 2024 lows, giving the Fed a nudge toward easing without full-blown panic.
GDP Growth: A modest 1.8–2.0% annualized rate, signaling a soft-landing scenario rather than a recession — which actually makes the Fed less urgent about cutting aggressively.
CME FedWatch Tool (April 2026 projections): Markets are pricing in roughly a 60–65% probability of at least one 25 basis point cut by June 2026, with a stronger consensus forming around September 2026.
So what does all this mean? The Fed isn’t panicking, and they’re not rushing. They’re essentially playing a game of chicken with inflation — waiting for it to blink first.
Why Is the Fed Being So Cautious in 2026?
This is the part that trips most people up. Many expected 2026 to bring a cascade of rate cuts — a sort of monetary relief valve after years of tightening. But a few key factors are keeping Fed Chair Jerome Powell and the FOMC committee from going full dove:
Services inflation is sticky: Housing costs, healthcare, and insurance premiums remain elevated, refusing to cool as quickly as goods inflation did.
Geopolitical supply chain disruptions: Ongoing tensions in key trade corridors have kept import prices unpredictable, adding an inflationary wildcard.
Strong consumer spending: American consumers haven’t slowed down as much as the Fed hoped — credit card spending remains above trend, which signals continued demand-side pressure.
The ‘credibility trap’: The Fed is acutely aware that cutting too soon and then having to reverse course (as was feared in 2023) would be a massive credibility blow. They’d rather be late than wrong.
Global Context: What Are Other Central Banks Doing?
Here’s where things get interesting. The Fed doesn’t operate in a vacuum, and comparing its approach to other major central banks gives us useful perspective.
The European Central Bank (ECB) has been more aggressive, cutting rates three times since late 2024, bringing its deposit rate to around 2.25% by early 2026. Europe’s growth concerns outweighed inflation fears, so the ECB blinked first. The result? A weaker euro relative to the dollar, which has actually created some headaches for U.S. exporters — another indirect reason the Fed is watching global currency dynamics carefully.
Meanwhile, the Bank of Japan (BOJ) — long the outlier with ultra-loose policy — has slowly normalized, nudging rates higher. This unwinding of the yen carry trade has had ripple effects across global asset markets, adding another layer of complexity for the Fed to navigate.
In emerging markets like South Korea and Brazil, central banks have been caught in a tough spot: their currencies have weakened against a still-strong dollar, making imports more expensive and limiting their own rate-cutting ambitions despite softer domestic economies.
What Does This Mean for You — Practically?
Okay, let’s get real. Whether you’re a first-time homebuyer waiting for mortgage rates to drop, an investor wondering about bond positioning, or just someone with a high-yield savings account, here’s how to think about this strategically:
If you’re a homebuyer: Mortgage rates likely won’t drop dramatically even if the Fed cuts in mid-2026 — markets have already partially priced in modest cuts. A 6.5–7% mortgage rate environment could persist through 2026. Consider ARMs (adjustable-rate mortgages) carefully, or explore assumable mortgages on existing homes.
If you’re an investor in bonds: Locking in longer-duration Treasuries now (10–20 year) could be a smart move if you believe rates will fall meaningfully over the next 2–3 years. Duration risk works in your favor in a falling rate environment.
If you hold cash in HYSAs or CDs: Don’t panic, but do consider laddering CDs at current rates (still around 4–4.5% for 1-year CDs) before those yields compress. This is arguably one of the last windows for locking in solid, risk-free returns.
If you run a small business: Refinancing variable-rate debt sooner rather than later might make sense, especially if a cut or two materializes in H2 2026 — don’t wait for the dramatic bottom.
Stock market positioning: Rate-sensitive sectors like REITs, utilities, and small-cap stocks have historically outperformed once the cutting cycle begins in earnest. Gradually building exposure there could be strategic — but pace yourself, because timing the exact bottom is a fool’s errand.
Realistic Alternatives If the Fed Delays Further
Let’s be honest — there’s a real scenario where the Fed only manages one or two cuts in all of 2026. If that happens, here’s how to adapt:
Rather than waiting passively, consider dividend-growth stocks as a hybrid income/appreciation play. Companies with strong free cash flow and consistent dividend growth (think consumer staples, healthcare) can deliver returns even in a higher-for-longer environment. Also, I-bonds and TIPS (inflation-protected securities) remain relevant if inflation stays elevated — they’re unglamorous but genuinely useful tools.
For the real estate crowd, house hacking (buying a multi-unit property and renting out units to offset your mortgage) or exploring markets where home prices have corrected more significantly (parts of the Sun Belt have seen 10–15% corrections from peak) can make the math work even at today’s rates.
The bottom line? Waiting for the “perfect” rate environment is a strategy that tends to cost more than it saves. The Fed will cut — the question is when and how much. Building your financial plan around ranges of outcomes rather than pinning everything on one scenario is the mature, effective approach.
Editor’s Comment : The Fed’s 2026 rate cut journey is less of a light switch and more of a dimmer — gradual, conditional, and dependent on data points that can shift month to month. The smartest thing you can do isn’t to predict the Fed perfectly (nobody can), but to build financial flexibility into your decisions. Lock in what makes sense today, stay liquid enough to act when opportunities shift, and resist the temptation to bet everything on a rate cut bonanza that may arrive later — and smaller — than the headlines suggest. The soft landing is real, but so is the patience required to navigate it well.
지난해 말, 한 지인이 이런 말을 했어요. “금리가 내려간다고 해서 대출 갈아타기를 준비했는데, 결국 아무것도 안 내렸잖아요.” 그 분만의 이야기가 아닐 거예요. 2025년 내내 ‘금리인하 임박’이라는 뉴스가 쏟아졌지만, 연준(Fed)은 생각보다 훨씬 신중하게 움직였고, 시장의 기대는 반복적으로 빗나갔습니다. 그렇다면 2026년은 다를까요? 오늘은 미국 연방준비제도의 금리인하 시기를 둘러싼 핵심 시나리오들을 함께 짚어보려 합니다.
📊 현재 금리 수준과 2026년 인하 전망 수치 분석
2026년 4월 현재, 미국 기준금리(Federal Funds Rate)는 4.25~4.50% 수준에서 유지되고 있는 것으로 봅니다. 2025년 하반기에 소폭의 인하가 있었지만, 연준은 인플레이션이 목표치인 2%에 안정적으로 수렴하기 전까지는 섣불리 움직이지 않겠다는 기조를 일관되게 유지해왔어요.
시장에서 주목하는 주요 수치들을 정리해 보면 이렇습니다.
미국 PCE 물가지수: 연준이 가장 중시하는 인플레이션 지표로, 2026년 초 기준 약 2.4~2.6% 수준으로 아직 목표치 대비 소폭 상회 중인 것으로 라고 봅니다.
실업률: 4.2~4.5% 구간을 유지하며 고용 시장이 ‘완만한 냉각’ 국면에 접어든 것으로 보입니다. 이는 연준이 고용 악화를 명분으로 인하를 가속할 수 있는 조건이기도 해요.
CME 페드워치(FedWatch) 시장 기대: 2026년 상반기 내 최소 1~2회(0.25%p씩) 인하 가능성을 55~65% 수준으로 반영하고 있는 것 같습니다.
연준 점도표(Dot Plot): 2026년 말 기준금리 중앙값을 3.75~4.00%로 제시하고 있어, 연간 1~2회 인하가 ‘공식 시나리오’에 가까운 상황입니다.
결국 숫자만 놓고 보면, 2026년은 인하 사이클의 ‘재개 혹은 가속’이 기대되는 해이지만, 그 속도가 시장 기대만큼 빠를지는 여전히 미지수라고 봅니다.
🌍 국내외 사례로 보는 ‘기대와 현실의 간극’
역사적으로 연준의 금리 전환 시점은 항상 시장 컨센서스보다 늦게 찾아왔어요. 대표적인 사례가 2023~2024년 사이클입니다. 당시 월가는 2023년 하반기부터 금리인하를 점쳤지만, 실제 첫 인하는 2024년 9월에야 이루어졌습니다. 무려 9개월 이상의 지연이었죠.
반대의 사례도 있어요. 2020년 3월, 코로나19 팬데믹이라는 예외적 충격이 발생하자 연준은 단 2주 만에 기준금리를 1.50%p 전격 인하했습니다. 이처럼 연준의 금리 결정은 ‘예정된 경로’가 아니라 데이터와 외부 충격에 즉각 반응하는 유기적인 과정임을 보여주는 사례라고 봅니다.
국내 상황도 무관하지 않아요. 한국은행은 전통적으로 미국 연준의 통화정책과 일정한 거리를 유지하면서도, 달러 강세·원화 약세 압력을 견디기 위해 금리 차를 의식하지 않을 수 없습니다. 연준이 인하를 서두를수록 한은의 추가 인하 여지도 넓어지는 구조예요. 2026년 한국 기준금리 역시 이 흐름과 맞물려 움직일 가능성이 높다고 봅니다.
⚠️ 금리인하를 늦출 수 있는 변수들
낙관적인 전망만 있는 건 아닙니다. 다음과 같은 변수들이 연준의 발목을 잡을 수 있어요.
관세 발 인플레이션 재점화: 2026년에도 미·중 무역 긴장이 완전히 해소되지 않은 상황에서, 수입 물가 상승이 PCE를 다시 자극할 수 있는 것 같습니다.
에너지 가격 변동성: 중동 지역 지정학적 불안이나 OPEC+의 감산 결정은 유가를 통해 기대 인플레이션을 흔들 수 있어요.
미국 재정 적자 확대: 국채 발행 증가로 장기 금리(10년물 국채 수익률)가 높은 수준을 유지할 경우, 연준이 단기금리를 내려도 실질적인 대출 시장 효과는 제한적일 수 있습니다.
고용 시장의 ‘끈적함(Stickiness)’: 실업률이 예상보다 낮은 수준을 유지한다면, 연준은 “서두를 이유가 없다”는 입장을 고수할 가능성이 높습니다.
💡 결론 및 현실적 대안: 우리는 어떻게 준비해야 할까요?
금리인하 시기를 정확히 맞추는 건 사실상 불가능에 가까운 일이라고 봅니다. 연준 위원들조차 매 회의마다 전망을 수정하는 상황에서, 개인이 ‘정확한 타이밍’에 베팅하는 건 오히려 리스크가 크죠. 그렇다면 우리가 현실적으로 취할 수 있는 접근법은 뭘까요?
단기 고금리 예금·채권 활용: 아직 금리인하가 본격화되지 않은 지금, 단기 고금리 상품으로 이자 수익을 최대화하는 전략이 유효한 것 같습니다.
장기채 분할 매수: 인하 사이클이 시작되면 장기채 가격은 오르는 경향이 있어요. 지금부터 분할 매수로 포지션을 쌓아가는 것도 합리적인 접근이라고 봅니다.
변동금리 대출 재점검: 변동금리 주택담보대출을 보유하고 있다면, 금리인하 시기에 맞춰 고정금리 전환 여부를 미리 시뮬레이션해 두는 게 좋아요.
환율 변동성 대비: 연준 인하 기대가 커질수록 달러 약세 압력이 생기고, 원화 강세로 이어질 수 있어요. 달러 자산 비중을 조정하는 타이밍을 미리 고민해 보는 것도 인 것 같습니다.
에디터 코멘트 : 솔직히 말하면, 2026년 금리인하 시기를 두고 전문가들도 의견이 엇갈리고 있어요. 중요한 건 ‘언제 내리느냐’보다 ‘내렸을 때 내가 어떤 포지션에 있느냐’라고 봅니다. 지금 이 순간 ‘금리인하를 기다리며 아무것도 안 하는 것’이 사실 가장 위험한 선택일 수 있어요. 시나리오별로 미리 준비해두는 것, 그게 2026년 금리 환경에서 개인이 할 수 있는 가장 현명한 대응인 것 같습니다.
Back in early 2022, a friend of mine who runs a mid-sized furniture manufacturing business told me something that stuck with me: “I used to price my products six months in advance. Now I can barely predict next week.” That conversation perfectly captures what raw material volatility feels like from the ground level. Fast forward to 2026, and while the dust has settled somewhat from the post-pandemic supply chain chaos, we’re navigating a whole new set of economic pressures — geopolitical realignments, the green energy transition, and shifting demand from Asia’s evolving industrial base.
So let’s think through what the 2026 raw material price landscape actually looks like, what’s driving it, and — most importantly — what you can realistically do about it whether you’re a business owner, investor, or just someone trying to understand why everyday goods keep getting more expensive.
📊 The Big Picture: Where Raw Material Prices Stand in 2026
Heading into 2026, the global commodities market is operating under what analysts are calling a “constrained equilibrium” — prices are neither in freefall nor in runaway inflation territory, but they’re being held up by structural forces that aren’t going away anytime soon.
Here’s a snapshot of key sectors:
Energy (Oil & Natural Gas): Brent crude has been hovering in the $78–$90 per barrel range through Q1 2026, influenced by OPEC+ production discipline and continued demand from Southeast Asian manufacturing hubs. European natural gas markets remain sensitive following the ongoing restructuring of supply chains away from Russian dependency.
Metals — Base: Copper prices remain elevated above $9,500/metric ton, largely because of surging demand from EV battery infrastructure and grid expansion projects in the US, EU, and China. Aluminum has seen moderate relief as smelting capacity recovered in parts of the Middle East and Southeast Asia.
Metals — Precious: Gold has held strong above $2,700/oz in 2026, serving as a hedge against dollar fluctuation and ongoing geopolitical uncertainty. Silver is benefiting from dual demand — both as an investment hedge and as a critical input for solar panels.
Agricultural Commodities: Wheat and corn prices have stabilized compared to 2022–2023 peaks, but remain structurally higher than pre-2020 baselines due to climate-related yield unpredictability and higher fertilizer costs (which are themselves tied to natural gas pricing).
Critical Minerals (Lithium, Cobalt, Nickel): This is arguably the most volatile segment of 2026. Lithium saw a dramatic price correction in 2024–2025 after oversupply from Australian and South American mines, but is recovering as EV adoption accelerates. Cobalt remains geopolitically sensitive given DRC supply concentration.
🔍 The Structural Drivers You Need to Understand
Raw material prices don’t move in a vacuum — they’re the output of intersecting forces. Let’s break down the three biggest ones shaping 2026:
1. The Green Transition Premium Decarbonization isn’t just an environmental story — it’s a commodity super-cycle story. The International Energy Agency estimated that transitioning to net-zero requires roughly six times more minerals than a fossil-fuel-based energy system. In 2026, that demand is increasingly real and visible: copper wiring for offshore wind, lithium for grid storage, rare earth elements for EV motors. This is structurally bullish for a specific basket of materials over the next decade.
2. Geopolitical Fragmentation The world isn’t exactly deglobalizing, but it is “friend-shoring” — meaning supply chains are being rebuilt along geopolitical alliances rather than pure economic efficiency. This adds cost and friction. The US Inflation Reduction Act and the EU’s Critical Raw Materials Act, both now in full implementation mode in 2026, are reshaping where materials are sourced and processed, adding premiums to domestically aligned supply chains.
3. Dollar Dynamics & Emerging Market Demand Commodities are predominantly dollar-denominated, so USD strength/weakness plays a huge role. In 2026, the Federal Reserve’s cautious easing cycle has kept the dollar in a relatively stable but slightly weakened position compared to its 2022–2023 highs — this is mildly supportive for commodity prices globally. Meanwhile, India’s continued industrial buildout is emerging as a new pillar of raw material demand, partially compensating for China’s slower growth trajectory.
🌍 Real-World Examples: How Different Economies Are Responding
Let’s ground this in actual case studies, because the abstract data only tells part of the story.
South Korea — Steel & Semiconductor Materials: South Korea’s POSCO has been aggressively diversifying its iron ore supply away from single-country dependency, with new long-term contracts signed with Canadian and Australian suppliers in late 2025. For the semiconductor sector, Korean firms like Samsung and SK Hynix are navigating rare gas and specialty chemical supply constraints by investing in domestic recycling and purification technology — a smart hedge against import volatility.
Germany — Industrial Manufacturing Under Pressure: German Mittelstand (mid-sized industrial companies) are among the hardest hit by elevated energy and metal input costs in 2026. The German government’s industrial energy subsidy program, extended into 2026, has provided some relief, but many manufacturers are accelerating automation investment to reduce material waste per unit output — effectively managing price exposure through efficiency gains.
United States — The Critical Minerals Buildout: The Biden-to-current-administration transition hasn’t meaningfully reversed the Critical Minerals Strategy. Domestic lithium projects in Nevada and North Carolina are ramping production, and the DoE’s loan programs are backing new processing facilities. This is beginning to create a modest domestic supply buffer, though full self-sufficiency remains 5–10 years away.
Brazil & Indonesia — The Supplier Power Shift: Both countries are increasingly asserting resource nationalism — requiring more domestic processing before export (Indonesia’s nickel ore export ban, Brazil’s leverage in iron ore negotiations). This is reshaping the cost structure for manufacturers globally and adding a “sovereignty premium” to raw material prices.
💡 Realistic Strategies: What Can You Actually Do?
Here’s where I want to be practical rather than just analytical. Depending on your situation, the 2026 raw material environment calls for different responses:
For small business owners (manufacturing/retail): Consider locking in forward contracts for your top 2–3 input materials where possible. Even simple 3–6 month price agreements with suppliers provide meaningful budget predictability. Also, audit your material waste — a 10% efficiency improvement can offset a 10% price increase.
For investors: A diversified commodities ETF exposure (covering energy, base metals, and agriculture) makes more sense in 2026 than concentrated single-commodity bets. Critical minerals funds with ESG screening are gaining traction for those with a longer time horizon. But be aware of the lithium price volatility — timing matters here.
For consumers trying to understand cost-of-living pressures: Higher raw material costs flow through to finished goods with a 6–18 month lag typically. If copper and aluminum stay elevated, expect appliance and electronics prices to tick up in late 2026. This is worth factoring into major purchase timing.
For policymakers and procurement professionals: Supply chain mapping — knowing exactly where your Tier 2 and Tier 3 suppliers source materials — has become non-negotiable. The companies and agencies that built this visibility in 2023–2024 are significantly more resilient in 2026.
⚖️ The Balanced View: Reasons for Caution vs. Reasons for Optimism
It’s tempting to go full doom-and-gloom or full optimism on commodities — both are wrong. Here’s a more balanced read:
Reasons prices could ease: Lithium and nickel supply expansions are genuinely coming online. China’s slower-than-expected industrial recovery is dampening demand for steel and base metals. Technological efficiency in manufacturing (less material per unit of output) is a quiet but real deflationary force.
Reasons prices could stay elevated or spike: Climate disruptions to agricultural supply (unpredictable and underpriced by markets). Any escalation in major geopolitical flashpoints affecting shipping lanes or mining regions. The green transition demand curve accelerating faster than supply investment can respond.
The honest answer is: expect continued volatility within a structurally elevated range for most industrial commodities through at least 2028.
Editor’s Comment : What I find most fascinating about the 2026 commodity landscape is that it’s forcing a kind of strategic maturity on businesses and investors that the cheap-money, cheap-materials era of 2010–2019 didn’t require. The companies navigating this best aren’t necessarily the ones with the deepest pockets — they’re the ones thinking three supply chain steps ahead and treating material cost management as a core competency rather than an afterthought. If there’s one takeaway here: volatility isn’t going away, so adaptability is the real asset worth investing in.
얼마 전 지인 한 명이 이런 말을 했어요. “요즘 마트 가격이 왜 이렇게 오른 건지 모르겠어. 월급은 그대로인데.” 식료품부터 전자제품까지, 일상 속 물가 변화를 피부로 느끼는 분들이 점점 많아지고 있죠. 그런데 사실 그 가격 변동의 뿌리를 따라가다 보면, 결국 원자재 시장이라는 거대한 흐름과 만나게 됩니다.
2026년 현재, 글로벌 공급망은 코로나 이후의 재편을 완전히 마무리하지 못한 채 새로운 지정학적 긴장과 에너지 전환이라는 두 가지 거대한 파도 위에 놓여 있어요. 오늘은 그 흐름을 함께 짚어보고, 우리 삶에 어떤 영향을 주는지 가능한 한 구체적으로 풀어볼게요.
📊 2026년 주요 원자재 가격 현황 — 숫자로 보는 현실
먼저 주요 원자재의 흐름을 대략적으로 살펴볼게요. 2026년 1분기 기준으로 시장에서 관측되는 흐름은 다음과 같습니다.
국제 유가(WTI 기준): 배럴당 약 72~80달러 수준에서 등락을 반복하고 있어요. OPEC+의 감산 기조가 유지되는 한편, 미국 셰일 오일 생산량이 다시 증가세를 보이며 상단을 억제하고 있는 구조입니다.
구리(Copper): 톤당 9,200~9,800달러 사이. AI 데이터센터 확장과 전기차 인프라 수요가 맞물리며 구조적 강세를 이어가고 있다고 봅니다. 일부 기관은 2026년 하반기에 10,000달러 돌파 가능성도 제시하고 있어요.
리튬(Lithium): 2023~2024년의 급락 이후 안정화 국면. 탄산리튬 기준 톤당 약 13,000~15,000달러 선. 전기차 보급 속도와 직결되어 있는 만큼 예측 변동성이 여전히 높은 편이에요.
밀(Wheat) 및 곡물: 우크라이나·러시아 정세가 장기 교착 상태를 유지하면서 곡물 수출 경로의 불안정성이 지속되고 있어요. 시카고 밀 선물은 부셸당 570~620센트 수준에서 움직이고 있습니다.
금(Gold): 온스당 2,900~3,100달러 구간. 중앙은행들의 금 매입 지속, 달러 약세 우려, 지정학적 불확실성이 복합적으로 작용하며 역사적 고점 부근을 유지하고 있는 인 것 같습니다.
수치만 나열하면 다소 건조하게 느껴질 수 있는데요. 핵심은 이 숫자들이 서로 독립적으로 움직이지 않는다는 점이에요. 유가가 오르면 비료 생산 비용이 오르고, 그게 곡물 가격으로 이어지는 연쇄 구조가 있거든요.
🌍 국내외 사례로 보는 원자재 충격의 실제 파급력
해외 사례 — 칠레·인도네시아의 자원 민족주의 부상
구리 최대 생산국인 칠레와 니켈 핵심 공급처인 인도네시아는 2025년 이후 자원 수출에 대한 규제와 세금을 강화하는 추세를 이어가고 있어요. 단순히 “자원을 팔아 돈 버는” 방식에서 벗어나 자국 내 배터리·정제 산업을 키우겠다는 전략인 거죠. 이 흐름은 글로벌 공급 안정성에 중장기적인 리스크 요인으로 작용하고 있다고 봅니다.
국내 사례 — 제조업 원가 압력과 중소기업의 딜레마
한국은 원자재 수입 의존도가 매우 높은 구조예요. 철강, 알루미늄, 희소금속 등 핵심 소재의 상당 부분을 수입에 의존하고 있죠. 2026년 들어 원·달러 환율이 1,360~1,410원 수준에서 높은 변동성을 보이면서, 원자재 가격 상승이 환율 리스크와 이중으로 작용하는 상황입니다. 특히 자동차 부품, 전자 기기 제조 중소기업들은 원가 상승분을 납품 단가에 제대로 반영하지 못해 수익성 압박을 받는 경우가 많다는 이야기가 업계에서 자주 들려오고 있어요.
🔍 2026년 원자재 시장을 움직이는 3가지 핵심 변수
앞으로의 흐름을 예측하려면 변수를 좁혀서 보는 게 훨씬 효율적이에요. 제가 지금 가장 주의 깊게 보고 있는 요소는 세 가지입니다.
① 미국 연준(Fed)의 금리 정책: 2026년 상반기 기준으로 금리 인하 사이클이 조심스럽게 진행 중인 것으로 관측됩니다. 달러 약세 전환 여부가 원자재 전반의 달러 표시 가격에 직접적인 영향을 줄 수 있어요. 달러가 약해질수록 원자재는 상대적으로 비싸 보이는 효과가 생기거든요.
② 중국의 경기 부양 강도: 세계 최대 원자재 소비국인 중국의 내수 회복 속도가 여전히 핵심 변수입니다. 부동산 시장 안정화와 제조업 경기 회복이 얼마나 실질적으로 이루어지느냐에 따라 구리·철강·에너지 수요가 크게 흔들릴 수 있습니다.
③ 에너지 전환 속도: 태양광 패널, 풍력 터빈, 전기차 배터리에 들어가는 핵심 광물(리튬·코발트·망간·희토류)에 대한 수요는 구조적으로 증가하는 추세예요. 단기 조정이 있더라도 중장기 방향성 자체는 상방인 것 같습니다.
💡 결론 — 개인과 기업이 취할 수 있는 현실적인 대응 전략
원자재 시장은 어느 한 전문가도 “이렇게 된다”고 단언하기 어려운 영역이에요. 하지만 방향성과 리스크를 인식하고 준비하는 것과 그렇지 않은 것은 결과에서 큰 차이를 만들어냅니다.
개인 투자자라면 원자재 ETF나 관련 주식에 직접 투자하는 것보다, 물가 상승에 대한 헷지 수단으로서 금 비중 5~10% 내외를 포트폴리오에 포함하는 방식이 비교적 현실적인 접근이라고 봅니다. 기업의 경우라면 원자재 조달처 다변화와 장기 계약 비중을 점검하고, 환율 헷징 전략을 재점검하는 것이 지금 시점에서 의미 있는 행동이에요.
무엇보다 중요한 건, 원자재 가격 뉴스를 “나와 무관한 글로벌 이슈”로 흘려보내지 않는 시각이라고 생각해요. 우리가 매달 내는 전기·가스 요금, 마트에서 장 볼 때의 물가, 직장 다니는 회사의 원가 구조 — 이 모든 것이 연결되어 있으니까요.
에디터 코멘트 : 2026년 원자재 시장은 “한 방향으로 쭉 간다”기보다는 변수마다 엇갈리는 복잡한 장세가 펼쳐질 가능성이 높다고 봅니다. 구리와 금은 구조적 강세, 에너지는 레인지 등락, 곡물은 지정학 이슈에 따라 언제든 튈 수 있는 구조예요. 딱 하나만 기억하신다면 — 원자재는 글로벌 경제의 체온계라는 것, 그 체온계를 꾸준히 들여다보는 습관을 들이는 게 장기적으로 가장 좋은 준비라고 생각합니다.
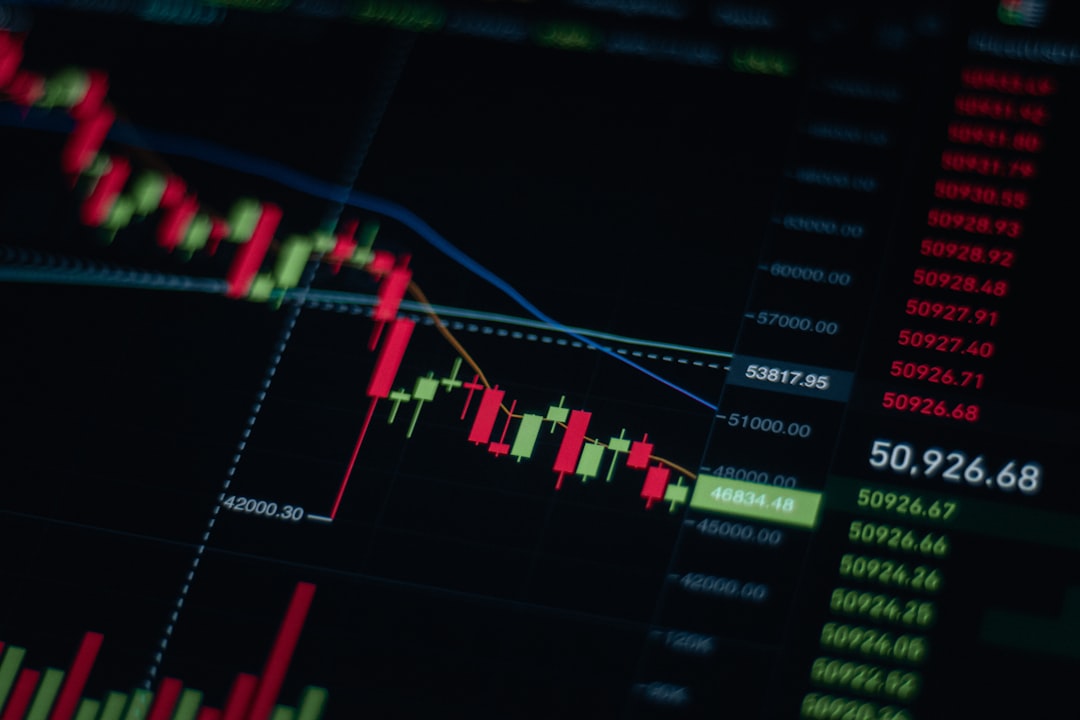
Picture this: It’s early 2026, crude oil prices are swinging wildly due to ongoing geopolitical tensions in the Middle East, and your colleague at work confidently tells you he just made a 30% return in three weeks trading oil futures. Sounds tempting, right? But before you rush to open a futures trading account, let’s slow down and actually think this through together — because commodity futures investing is one of those areas where the gap between potential reward and actual outcome can be genuinely dramatic.
I’ve seen enthusiastic investors dive into commodity futures without fully understanding what they’re getting into, and I’ve also seen seasoned portfolio managers use them brilliantly as a hedge. The difference? Knowledge, strategy, and realistic expectations. So let’s unpack this properly.
What Exactly Are Commodity Futures?
Before we get into pros and cons, let’s make sure we’re on the same page. A commodity future is a standardized legal contract to buy or sell a specific quantity of a raw material — think crude oil, gold, natural gas, soybeans, or copper — at a predetermined price on a specific future date. You’re essentially betting on where prices will go, without necessarily owning the physical asset.
In 2026, commodity futures are traded on major exchanges like the CME Group (Chicago Mercantile Exchange), ICE Futures, and internationally on platforms like the Shanghai Futures Exchange (SHFE). The daily trading volume for crude oil futures alone regularly exceeds $50 billion globally — it’s a massive, liquid market.
The Real Advantages of Commodity Futures Investing
Inflation Hedge: With global inflation remaining a concern in 2026, commodities like gold and energy tend to hold or increase their value when currency purchasing power erodes. Historically, commodity indices have shown a 0.7–0.9 positive correlation with CPI spikes.
Portfolio Diversification: Commodities often move independently of stocks and bonds. During equity market downturns, energy or agricultural futures can provide a buffer — this is the classic “uncorrelated asset” argument that portfolio managers love.
High Leverage Potential: Futures trading uses margin, meaning you control a large contract value with relatively little upfront capital. A 10% price move can yield a 100%+ return on your margin deposit. This is the “30% in three weeks” story your colleague was telling.
Market Liquidity: Major commodity futures (especially WTI crude, gold, and natural gas) are among the most liquid markets in the world. You can enter and exit positions quickly without significant slippage.
Transparent Pricing: Futures prices are publicly available and regulated, making them more transparent than many alternative investments.
The Very Real Disadvantages — Let’s Be Honest
Leverage Cuts Both Ways: That same 10% adverse move that could double your money? It can also wipe out your entire margin deposit — and then some, triggering a margin call where you owe money you didn’t plan to spend.
Contango & Rollover Costs: This is a sneaky one that trips up beginners. When futures contracts expire, you must “roll” into the next month’s contract. If the market is in contango (future prices higher than spot), each rollover costs you money. ETFs tracking oil futures famously lost value for years just due to contango drag.
High Complexity & Research Demands: Commodity prices are influenced by weather patterns, geopolitical events, supply chain data, central bank policies, currency fluctuations, and more. Staying truly informed is practically a full-time job.
Emotional Volatility: Commodity markets can move 5–10% in a single session on unexpected news. Most retail investors are not psychologically equipped for this kind of turbulence.
Tax Complexity: In many jurisdictions, futures profits are taxed under specialized rules (like the 60/40 rule in the U.S., or varying treatments internationally). You’ll want professional tax advice.
Real-World Examples: When It Worked and When It Didn’t
The Gold Rush of 2023–2024 (International Example): Investors who entered gold futures in late 2023 rode a significant rally as central banks globally increased gold reserves and geopolitical uncertainty spiked. By mid-2024, gold futures had surged past $2,400/oz. Those who understood the macro backdrop and managed risk well did exceptionally well. However, those who over-leveraged on silver futures during the same period faced brutal corrections when the Fed signaled rate policy shifts.
Korean Retail Investors & Oil ETFs (Domestic Example): In South Korea, a wave of retail investors in 2020 piled into oil-linked ETFs and ETNs when WTI crude briefly went negative. While some caught the recovery, many didn’t account for the severe contango drag in leveraged products. Korean financial authorities subsequently tightened regulations on high-leverage commodity products — a cautionary tale replicated globally.
Agricultural Futures in 2022–2026: The Russia-Ukraine conflict dramatically disrupted wheat and sunflower oil supply chains starting in 2022. Traders who understood geopolitical risk and held long wheat futures positions in early 2022 saw extraordinary returns. However, by 2025–2026, normalization of supply routes has made these same trades far less predictable, showing how macro contexts change rapidly.
So Who Should Actually Consider Commodity Futures?
Let’s be realistic here. Commodity futures in their direct form are genuinely suited for: institutional investors, professional traders with dedicated research capacity, or sophisticated individual investors with high risk tolerance, significant liquid capital, and the time to actively monitor positions. If that’s not you right now — and there’s absolutely no shame in that — there are smarter entry points.
Realistic Alternatives Worth Considering
Commodity ETFs (without heavy leverage): Products like the SPDR Gold Shares (GLD) or iShares S&P GSCI Commodity ETF give you commodity exposure without the complexity of rolling contracts yourself. Watch out for expense ratios and contango drag in energy ETFs specifically.
Mining & Energy Stocks: Investing in companies like Freeport-McMoRan (copper), Barrick Gold, or major energy producers gives you commodity price exposure with the added benefit of dividends and corporate governance. Less volatile than direct futures.
Commodity-Focused Mutual Funds or REITs: Professionally managed funds that specialize in natural resources can provide diversification while offloading the research burden to experts.
Micro Futures Contracts: CME Group now offers micro futures (e.g., Micro Gold, Micro WTI Crude Oil) with contract sizes 1/10th of standard contracts — a much lower-stakes way to learn the mechanics before committing serious capital.
Dollar-Cost Averaging into Commodity ETFs: Rather than trying to time the market, regularly investing a fixed amount into a broad commodity ETF smooths out volatility and removes the emotional timing pressure.
The right approach really depends on your financial situation, time availability, and risk profile. If you’re early in your investing journey, building familiarity through ETFs and individual stocks before touching leveraged futures is genuinely the wiser path — not a compromise, but smart sequencing.
Editor’s Comment : Commodity futures are a fascinating and legitimate investment tool — but they demand respect. In 2026, with inflation concerns, energy transition dynamics, and geopolitical volatility all in play, commodities as an asset class genuinely deserve a place in thoughtful portfolio discussions. Just make sure you’re choosing the right vehicle for your specific situation. Start small, understand the mechanics deeply (especially contango and leverage math), and never risk capital you can’t afford to lose entirely. The market will always be there when you’re ready — there’s no rush to overcommit.