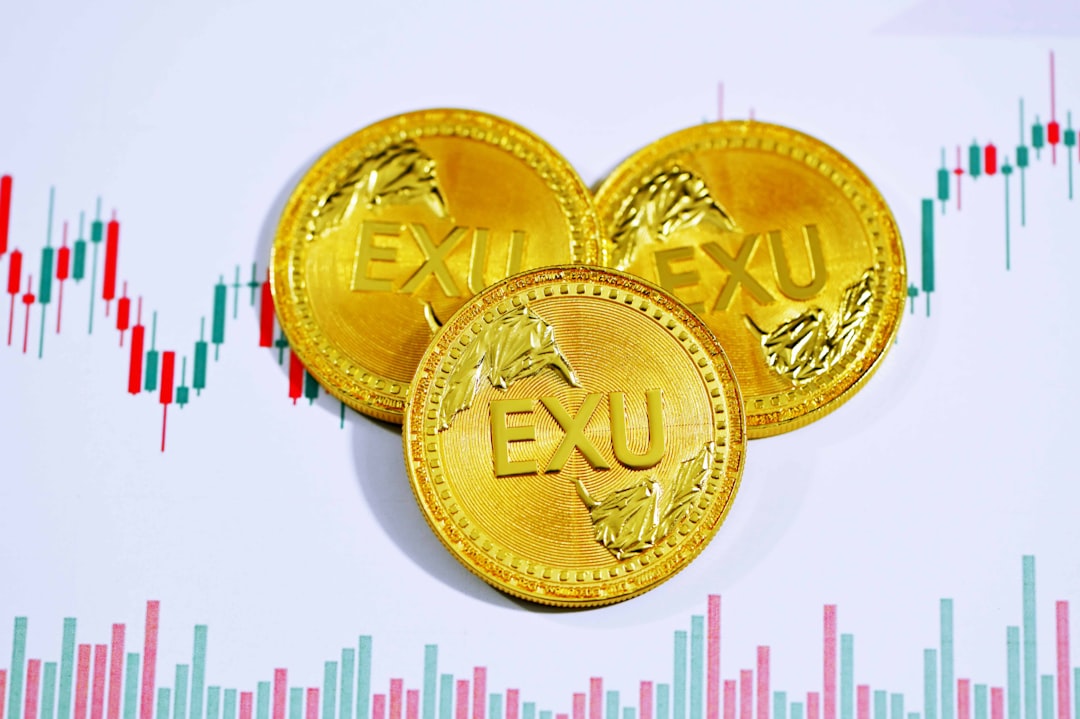
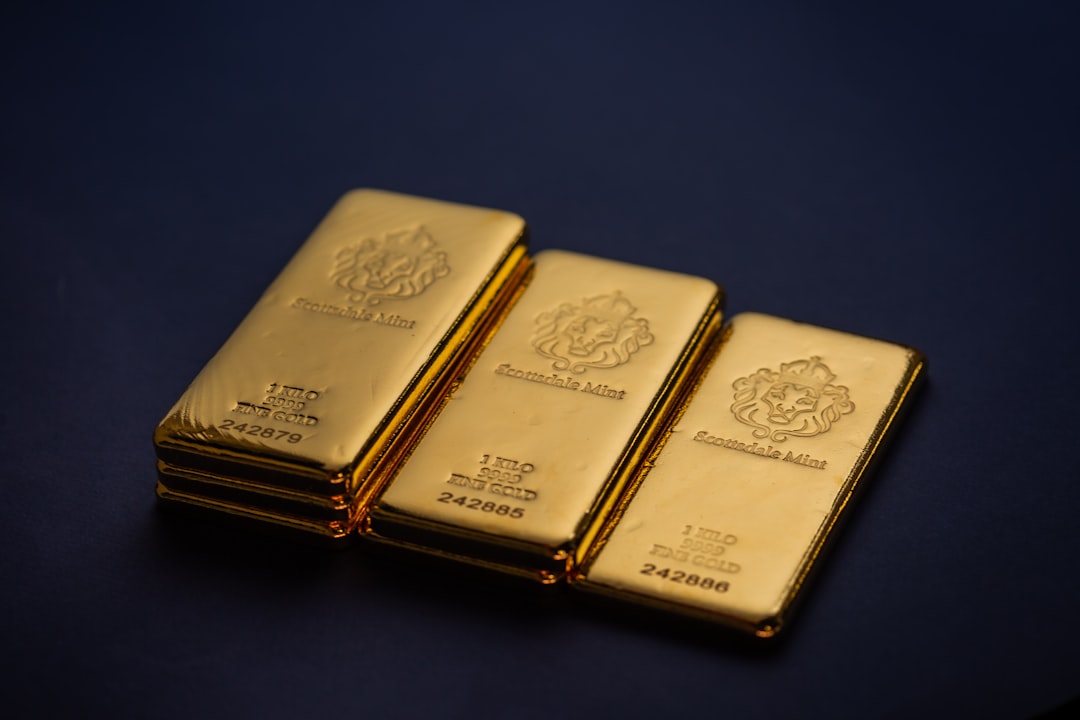
Let me take you back to early 2026. A friend of mine — a mid-level marketing manager with a modest savings account — called me in a mild panic. “Everyone’s talking about gold again,” she said. “But I don’t want to buy actual bars and store them under my bed.” Sound familiar? You’re definitely not alone. As global inflation continues to wrestle with central bank policies and geopolitical tensions remain stubbornly persistent, gold has once again become everyone’s favorite dinner-table investment topic. And thankfully, you don’t need a vault to participate. Gold commodity ETFs are arguably the most accessible, liquid, and cost-efficient way to get exposure to the precious metal in 2026 — and today we’re going to think through exactly how to use them.
What Exactly Is a Gold Commodity ETF?
Before we dive into strategy, let’s make sure we’re on the same page. A Gold Commodity ETF (Exchange-Traded Fund) is a fund that trades on a stock exchange just like a regular stock, but its value is tied to the price of gold. Some ETFs hold physical gold bullion in vaults (these are called physically-backed ETFs), while others use futures contracts to track gold prices synthetically. The difference matters more than you might think — physically-backed ETFs tend to track gold prices more closely, while futures-based ETFs can experience something called “roll costs” that slightly erode returns over time.
The 2026 Gold Market Landscape: What the Data Tells Us
Gold has been on a notable run. As of early 2026, spot gold prices have hovered in the $2,800–$3,100 per troy ounce range, reflecting continued demand from central banks (particularly in Asia and the Middle East), retail investors hedging against currency devaluation, and institutional players rebalancing portfolios away from volatile tech equities. The World Gold Council reported that central bank gold purchases in 2025 reached near-record levels for the third consecutive year, adding structural upward pressure to prices.
For retail investors, this environment makes gold ETFs especially compelling — not as a get-rich-quick play, but as a portfolio stabilizer and inflation hedge. Historically, gold has maintained a low or negative correlation with equities, meaning it often holds value (or gains) when stock markets fall. That diversification benefit is very real in 2026’s mixed macro environment.
Top Gold ETFs Worth Knowing in 2026
Here’s a breakdown of some of the most widely traded gold ETFs this year, with key characteristics to help you compare:
SPDR Gold Shares (GLD) — The granddaddy of gold ETFs. Physically backed, massive liquidity, and widely available on US brokerage platforms. Expense ratio: ~0.40%. Best for: investors who want rock-solid liquidity and global recognition.
iShares Gold Trust (IAU) — Also physically backed but with a lower expense ratio (~0.25%). A slightly smaller fund than GLD but extremely popular with cost-conscious long-term holders.
Aberdeen Standard Physical Gold Shares ETF (SGOL) — Stores gold in Swiss vaults, which appeals to investors who appreciate geographic diversification of custody. Expense ratio: ~0.17%.
VanEck Merk Gold Trust (OUNZ) — Unique feature: you can actually redeem shares for physical gold delivered to you. A favorite among gold purists.
Korea’s KODEX Gold Futures ETF (한국) — For readers investing through Korean brokerage accounts (e.g., Kiwoom, Mirae Asset), this futures-based domestic ETF offers easy access without currency conversion. Note the futures roll cost consideration.
iShares Physical Gold ETC (IGLN) — London-listed — Popular among European and UK investors; trades in USD and GBP, physically backed and low-cost.
Domestic vs. International ETF Access: A Practical Comparison
One question I hear constantly: “Should I buy a US-listed gold ETF or a domestic one?” The honest answer is — it depends on your brokerage setup, tax situation, and how much currency risk you’re comfortable with.
If you’re a Korean investor, for example, buying GLD through a foreign stock account means your returns are affected by the KRW/USD exchange rate. When the dollar strengthens against the Korean won, your returns get a bonus boost; when the dollar weakens, it cuts into gains even if gold prices rose. Domestic ETFs like KODEX Gold Futures or TIGER Gold Futures remove that currency layer — but they introduce futures roll costs and may not track spot gold as cleanly. For US-based investors, this is a non-issue, but it’s worth flagging for international readers.
In Japan, ETFs like NEXT FUNDS Gold Price Linked ETF (1328) on the Tokyo Stock Exchange offer yen-denominated exposure, which has been particularly interesting in 2026 given ongoing yen volatility. Similarly, European investors have benefited from the spread of physically-backed ETCs (Exchange-Traded Commodities) across Euronext and the London Stock Exchange.
How Much Should You Actually Allocate to Gold ETFs?
This is where I want us to think realistically together, rather than throwing out a generic number. The classic “10% in gold” rule of thumb has been around for decades, but your ideal allocation really depends on:
Your investment horizon: Gold shines as a long-term hedge, not a short-term trade. If you’re investing for 10+ years, a 5–15% allocation makes logical sense.
Your existing equity exposure: If your portfolio is already heavy in international stocks and bonds, gold adds meaningful diversification. If you’re mostly in cash or real estate, the case is weaker.
Your inflation outlook: Believe inflation will remain sticky through the late 2020s? Lean toward the higher end. Think central banks have it under control? A smaller satellite position works fine.
Your risk tolerance: Gold can be volatile month-to-month even if it’s stable decade-to-decade. Don’t over-allocate if price swings will keep you up at night.
Step-by-Step: How to Actually Buy a Gold ETF in 2026
Let’s make this concrete. Here’s a simplified flow for most retail investors:
Step 1 — Choose your brokerage: In the US, Fidelity, Schwab, and TD Ameritrade all support ETF trading with zero commission. Internationally, platforms like Interactive Brokers give access to global ETFs. Korean investors can use Kiwoom Securities or Samsung Securities for both domestic and foreign ETFs.
Step 2 — Decide: physical-backed or futures-based? For most long-term investors, physically-backed (GLD, IAU, SGOL) is the cleaner choice due to better price tracking.
Step 3 — Check the expense ratio: Over 10 years, the difference between a 0.40% and 0.17% expense ratio is real money. Don’t ignore it.
Step 4 — Place a limit order, not a market order: Gold ETFs are liquid, but during volatile sessions, limit orders protect you from unfavorable fills.
Step 5 — Set a review cadence: Check your gold position quarterly, not daily. Rebalance annually if your allocation drifts significantly from your target.
Tax Considerations You Shouldn’t Skip
Here’s something many new investors overlook: in the United States, physically-backed gold ETFs are classified as collectibles by the IRS, which means long-term capital gains are taxed at a maximum rate of 28% — higher than the standard 15–20% long-term rate for most stock ETFs. This doesn’t make gold ETFs a bad investment, but it does mean holding them in a tax-advantaged account like a Roth IRA or Traditional IRA is especially advantageous. For non-US investors, consult your local tax authority on ETF classification rules, as they vary significantly by country.
Realistic Alternatives If Gold ETFs Don’t Fit Your Situation
Maybe your brokerage doesn’t support the ETF you want, or the tax situation is unfavorable, or you simply want more options on the table. Here are some thoughtful alternatives:
Gold Mining Stocks or ETFs (e.g., GDX, GDXJ): These give leveraged exposure to gold prices — mining companies benefit disproportionately when gold rises — but they carry operational and management risk beyond just the commodity price.
Gold Savings Accounts (골드뱅킹): In Korea, banks like KB Kookmin and Shinhan offer gold savings accounts where you buy gold in grams directly. No brokerage needed, no futures complications.
Digital Gold Platforms: Services like Kinesis Money or platforms integrated into fintech apps allow fractional gold ownership with blockchain-based certificates. Still emerging, but gaining traction in 2026.
Physical Gold (coins/bars): Still valid, especially for very long-term wealth preservation. Just factor in storage costs, insurance, and liquidity constraints.
Commodity Mutual Funds: If you’re not comfortable with ETF mechanics, some mutual funds offer gold exposure with active management — typically at a higher cost, but with a professional manager making tactical decisions.
The bottom line? Gold commodity ETFs in 2026 are genuinely one of the most elegant tools for everyday investors to access a multi-thousand-year store of value without ever touching a single gold coin. The key is matching the right ETF structure (physical vs. futures), the right allocation size, and the right account type to your personal financial picture. Don’t let analysis paralysis stop you — starting with even a small, intentional position beats waiting indefinitely for the “perfect” moment.
Editor’s Comment : I want to be honest with you — gold isn’t magic, and it won’t make you wealthy overnight. But as I’ve watched countless friends and readers build portfolios that weather economic storms, the ones who included a thoughtful gold allocation consistently slept better during market turbulence. In 2026’s complex macro environment, that peace of mind is genuinely worth something. Start small, understand what you own, and let compounding do its slow, steady work. 🏅
얼마 전 지인 한 명이 이런 말을 했어요. “금 사고 싶은데 실물로 사자니 보관이 걱정되고, 그렇다고 금 통장은 뭔가 허전하고… 그냥 주식처럼 살 수 없나?” 그 말이 꽤 많은 분들의 공통된 고민을 담고 있다고 생각했어요. 2026년 현재, 글로벌 경기 불확실성과 지정학적 리스크가 여전히 높게 유지되면서 금은 다시 한번 ‘안전자산’으로서의 존재감을 강하게 드러내고 있거든요. 그리고 그 해답으로 많은 투자자들이 주목하고 있는 게 바로 금 원자재 ETF입니다. 오늘은 금 ETF가 정확히 뭔지, 어떻게 고르고 어떻게 매수하는지 함께 뜯어볼게요.
📌 금 ETF란 무엇인가요? — 구조부터 이해하기
ETF(Exchange-Traded Fund)는 쉽게 말해 증권 거래소에 상장된 펀드예요. 금 ETF는 그 펀드의 기초자산이 ‘금’인 경우를 뜻합니다. 크게 두 가지 방식으로 나뉘는데요.
실물 금 기반 ETF: 펀드 운용사가 실제로 금괴를 금고에 보관하고, 그 보유량에 비례해 ETF 주식이 발행됩니다. 대표적으로 미국의 SPDR Gold Shares(GLD), iShares Gold Trust(IAU) 등이 있어요.
선물 기반 금 ETF: 실물 금을 직접 보유하지 않고 금 선물(futures) 계약을 굴리는 방식이에요. 롤오버(roll-over) 비용이 발생해 장기 보유 시 수익률이 실물 기반보다 다소 낮아질 수 있어요.
국내 상장 금 ETF: 한국거래소(KRX)에 상장된 ETF로, 원화로 간편하게 거래할 수 있습니다. 대표적으로 KODEX 골드선물(H), TIGER 골드선물(H) 등이 있어요.
환헤지(H) 여부도 중요한 포인트예요. ‘(H)’가 붙은 상품은 달러-원 환율 변동을 헤지(hedge)한 상품이라 금 가격 자체의 움직임만 반영되고, 헤지가 없는 상품은 금 가격 + 환율 변동이 동시에 수익률에 영향을 줍니다. 달러 강세가 예상된다면 환노출(non-hedge) 상품이, 금 가격 자체에만 집중하고 싶다면 환헤지 상품이 더 유리하다고 볼 수 있어요.
📊 2026년 금 시장 현황 — 숫자로 보는 맥락
2026년 4월 현재 국제 금 현물 가격은 트로이온스당 약 3,200~3,350달러 구간에서 거래되고 있는 것으로 파악돼요. 2022년 말 1,800달러 선이었던 것과 비교하면 약 75~80% 상승한 수준입니다. 배경을 짚어보면,
미국 연준(Fed)의 금리 인하 사이클 전환 이후 달러 약세 압력이 금 수요를 끌어올렸고,
중국·인도 등 신흥국 중앙은행들의 꾸준한 금 매입(중앙은행 순매입 규모가 2024~2025년 연속 1,000톤 이상),
중동·동유럽 지정학적 리스크가 안전자산 선호 심리를 자극하고 있다는 점이 주요 원인으로 꼽힙니다.
SPDR Gold Shares(GLD)의 운용자산(AUM)은 2026년 기준 약 800억 달러를 넘어서며 사상 최대 규모에 근접한 것으로 알려져 있어요. 그만큼 기관 및 개인 투자자 자금이 꾸준히 유입되고 있다는 방증이라고 봅니다.
🌍 국내외 금 ETF 투자 사례 — 어떻게 활용하고 있을까요?
미국의 경우, 자산배분 전략에서 금 ETF를 포트폴리오의 5~15% 비중으로 편입하는 것이 일반적인 권고안으로 자리잡고 있어요. 레이 달리오의 ‘올웨더 포트폴리오’에서 금을 7.5% 비중으로 설정하는 것이 그 대표적인 사례인데, 이는 주식·채권과의 낮은 상관관계(correlation)를 통해 포트폴리오 변동성을 줄이기 위한 목적이라고 봅니다.
국내에서도 2025년 하반기부터 개인 투자자들의 금 ETF 거래대금이 눈에 띄게 증가했어요. 특히 ISA(개인종합자산관리계좌)를 활용해 금 ETF에 투자하는 방식이 주목받고 있는데, ISA 계좌 내에서 발생한 금 ETF 수익은 200만~400만 원까지 비과세 혜택을 받을 수 있어서 세후 수익률 측면에서 유리하거든요. 금 ETF 수익에는 일반적으로 15.4%의 배당소득세가 부과되는 만큼, 이 절세 효과는 꽤 체감이 된다고 봅니다.
🛒 실전: 금 ETF 어떻게 매수하나요?
국내에서 금 ETF를 매수하는 방법은 일반 주식 매수와 완전히 동일해요. 증권사 앱(MTS)이나 PC HTS에서 티커명으로 검색한 뒤 수량을 입력하고 매수 주문을 넣으면 됩니다. 주요 상품과 특징을 간단히 정리해 볼게요.
KODEX 골드선물(H) [132030]: 가장 거래량이 많고 유동성이 높은 국내 금 ETF. 환헤지 상품으로 금 가격 추이에 집중 가능.
TIGER 골드선물(H) [319640]: KODEX와 유사한 구조. 총보수(운용 수수료)가 소폭 다를 수 있어 비교 후 선택 권장.
ACE KRX금현물 [411060]: 금 선물이 아닌 한국거래소 금 현물 가격을 추종. 선물 롤오버 비용이 없어 장기 투자에 더 유리하다는 평가를 받아요.
미국 상장 GLD / IAU: 해외 주식 계좌를 통해 달러로 투자 가능. 운용자산 규모가 크고 유동성 우수. IAU는 GLD보다 총보수가 낮아(0.25% vs 0.40%) 장기 투자에 소폭 유리한 편.
⚠️ 투자 전 반드시 체크해야 할 리스크
금은 이자나 배당이 없습니다. 순수하게 가격 상승에만 의존하는 자산이라 장기 보유 중 기회비용이 발생할 수 있어요.
달러 자산이라는 점. 환헤지가 없는 상품은 금 가격이 올라도 원화 강세 시 수익이 상쇄될 수 있어요.
금리 방향성과의 관계. 실질 금리가 상승하는 국면에서 금은 상대적으로 매력이 떨어지는 경향이 있어요. 2026년 현재 연준의 금리 정책 방향을 지속적으로 모니터링할 필요가 있다고 봅니다.
세금 처리. 국내 금 ETF의 매매차익은 배당소득세(15.4%) 과세 대상이므로 반드시 확인하세요. ISA 계좌 활용이 절세에 효과적입니다.
✅ 결론: 금 ETF, 이렇게 접근하는 게 현실적이라고 봅니다
금 ETF는 “대박을 노리는 공격적 투자 수단”이라기보다는 “포트폴리오 리스크를 분산시키는 완충재”로 바라보는 시각이 더 적합한 것 같아요. 전체 투자 자산의 10% 내외로 편입하고, ISA 계좌를 활용해 세금 부담을 줄이면서, 금리·환율 이슈를 꾸준히 체크하는 방식이 2026년 현재로서는 가장 현실적인 접근이라고 봅니다. 실물 금처럼 보관 걱정도 없고, 금 통장보다 투명하게 시세를 추적할 수 있으니 첫 원자재 투자 경험으로도 꽤 무난한 선택지라는 생각이 들어요.
에디터 코멘트 : 금 ETF를 처음 시작하신다면 국내 상장 ACE KRX금현물이나 KODEX 골드선물(H)로 소액(월 5~10만 원)부터 적립식으로 시작해 보시길 권해요. 금은 ‘언제 사느냐’보다 ‘얼마나 꾸준히 보유하느냐’가 더 중요한 자산이라고 봐요. 한 번에 큰 금액을 넣기보다 분할 매수로 평균 단가를 낮춰가는 전략이 심리적으로도, 수익률 측면에서도 훨씬 안정적인 것 같습니다.
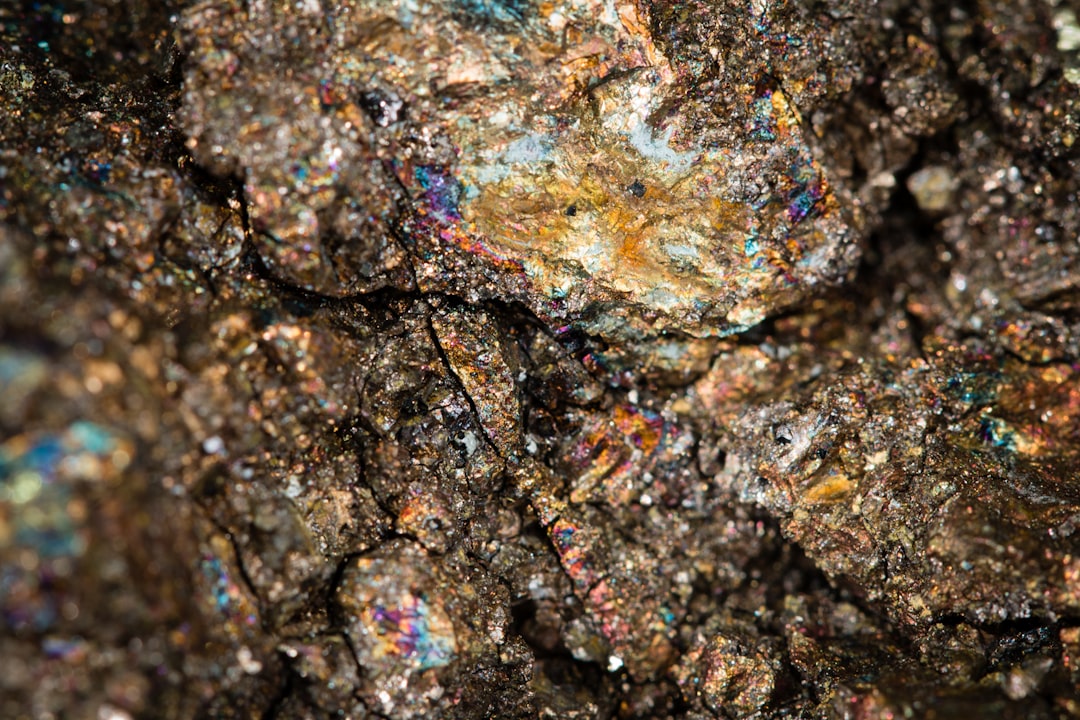
Picture this: It’s early 2026, and you’re watching the news. A major electric vehicle manufacturer just announced a partnership with a mining consortium in the Democratic Republic of Congo. Cobalt prices tick upward. Lithium futures shift. Your friend texts you: “Should we buy in?” Sound familiar? If you’ve been circling the rare metals investment space — particularly lithium and cobalt — you’re not alone. These two elements have become the unofficial mascots of the clean energy revolution, and understanding where they stand right now is genuinely fascinating. Let’s think through this together.
📊 Where Do Lithium and Cobalt Actually Stand in 2026?
Let’s ground ourselves in some real numbers first. After the dramatic price collapse of lithium carbonate between 2023 and 2025 — which saw prices drop from near-record highs of around $80,000/ton to a painful trough near $12,000/ton — the market has begun showing signs of structural stabilization in 2026. As of Q1 2026, lithium carbonate prices have recovered to approximately $18,000–$22,000 per metric ton, driven largely by renewed EV demand in Southeast Asia and India’s aggressive electrification push under its 2026 National EV Policy.
Cobalt, on the other hand, has had a different arc. Cobalt has been trading in the $28,000–$35,000/ton range in early 2026, supported by continued demand from aerospace batteries and energy storage systems (ESS), even as EV manufacturers like Tesla and BYD have aggressively pivoted toward LFP (lithium iron phosphate) batteries, which require zero cobalt. This is a critical wrinkle we’ll unpack below.
🔋 The LFP Disruption: Why Cobalt’s Story Got Complicated
Here’s the strategic tension that every savvy rare metals investor needs to understand in 2026: the very batteries that once made cobalt indispensable — NMC (Nickel Manganese Cobalt) chemistries — are being systematically displaced in the mass-market EV segment. By early 2026, LFP batteries account for roughly 58% of all EV battery deployments globally, according to BloombergNEF estimates. That’s a massive shift from just 38% in 2022.
So why does cobalt still have a pulse? Two reasons:
High-energy-density applications: Premium EVs (think long-range performance vehicles), aviation electrification, and military-grade energy systems still rely on NMC or NCA chemistries that require cobalt for energy density advantages.
ESS (Energy Storage Systems): Grid-scale batteries, which are exploding in deployment alongside solar and wind farms, often use cobalt-containing chemistries in specific configurations.
Supply concentration risk: Over 70% of global cobalt still originates from the DRC, creating persistent geopolitical risk premiums that keep prices from collapsing entirely.
Recycling bottleneck: Battery recycling infrastructure, while growing, still cannot supply enough secondary cobalt to offset primary mining demand — creating a supply-demand floor.
🌍 Global & Domestic Examples: Who’s Moving and How?
Let’s look at how major players are positioning themselves in 2026’s rare metals landscape.
South Korea (Domestic Example): POSCO Holdings — South Korea’s industrial giant — has doubled down on its lithium extraction operations in Argentina’s Lithium Triangle through its subsidiary POSCO Argentina. By Q1 2026, they’ve begun commercial-scale production from their Sal de Oro project, targeting 25,000 tons of lithium hydroxide annually. The Korean government has also designated lithium and cobalt as “National Strategic Minerals,” unlocking subsidized financing for domestic processing facilities in Gwangyang and Pohang.
United States: The Biden-era critical minerals strategy, now continued under the current administration, has funneled over $4.2 billion into domestic lithium projects. Lithium Americas’ Thacker Pass mine in Nevada finally reached partial commercial production in late 2025 and is ramping output through 2026. This is reshaping North American supply chains and reducing dependence on Chinese processing, which still controls roughly 65% of global lithium refining capacity.
China: CATL and Ganfeng Lithium continue to dominate the global lithium supply chain, but both companies have been quietly diversifying into sodium-ion battery production — a technology that requires neither lithium nor cobalt. This strategic hedge tells you a lot about how even the biggest players see the long-term risk landscape.
Australia: Pilbara Minerals and Liontown Resources are benefitting from renewed demand, with several Japanese and European automakers signing long-term offtake agreements in 2026 to secure “green lithium” with ESG-compliant extraction credentials — a growing premium category in the market.
💡 So Should You Actually Invest? Let’s Think Realistically
Here’s where we need to be genuinely honest with each other. Rare metals investing is not like buying an index fund. The volatility is extreme, the market cycles are long, and the geopolitical dependencies are real. That said, there are several legitimate entry points depending on your situation and risk appetite:
Option 1 — Mining Stocks (Higher Risk, Higher Upside): Companies like Pilbara Minerals (PLS.AX), Albemarle (ALB), and Lithium Americas (LAC) offer direct exposure to lithium price movements. Be prepared for 30–50% drawdown scenarios during demand troughs.
Option 2 — ETFs (Moderate Risk, Diversified): Funds like the Global X Lithium & Battery Tech ETF (LIT) or Amplify Lithium & Battery Technology ETF (BATT) spread risk across the value chain — from miners to battery manufacturers to recyclers. This is often the most realistic entry point for individual investors.
Option 3 — Battery Recycling Exposure (Lower Risk, Long-Term Play): Companies focused on lithium and cobalt recycling — like Li-Cycle and Redwood Materials — represent a more defensive position that benefits regardless of whether primary mining prices rise or fall, because recycled material demand grows with the overall battery installed base.
Option 4 — Indirect Exposure via EV/ESS Manufacturers: If rare metals feel too volatile, investing in the companies that consume these metals (EV makers, battery producers) gives you adjacency without direct commodity price exposure.
Option 5 — Avoid Physical Holding: Unlike gold or silver, physically holding lithium or cobalt is not a realistic option for individual investors due to storage, safety, and liquidity constraints. Stick to paper instruments.
⚠️ The Risks You Absolutely Cannot Ignore
Let’s be fair to both sides of the equation. The bull case for lithium and cobalt rests heavily on EV adoption curves that, while strong, have shown regional unevenness. Europe’s EV sales growth actually slowed in late 2025 due to subsidy rollbacks in Germany and France. Sodium-ion batteries are advancing faster than many predicted, with CATL’s sodium-ion cells achieving commercial viability in budget EVs. If this technology scales rapidly, it would materially reduce lithium demand — not eliminate it, but compress it significantly. The geopolitical risk around DRC cobalt is also a double-edged sword: it supports prices but also creates regulatory and ESG liabilities for investors exposed to artisanal mining supply chains.
🔮 What 2026’s Investment Climate Actually Suggests
The rare metals sector in 2026 is best described as a selective opportunity, not a blanket buy signal. Lithium looks more attractive than cobalt for long-term investors, primarily because its demand base is broader and less chemically substitutable in the near term. Cobalt requires a more tactical, shorter-term lens — watching the premium EV segment and ESS deployment rates closely. The smart money in 2026 seems to be positioning along the processing and recycling segments of the value chain, rather than pure-play upstream miners, precisely because these midstream players benefit from both primary and secondary material flows.
Editor’s Comment : Rare metals like lithium and cobalt are genuinely exciting investment territories in 2026 — but they reward patient, informed investors, not trend-chasers. The narrative has evolved significantly from the “buy everything battery-related” euphoria of a few years ago. What I find most compelling right now isn’t the miners themselves, but the recycling infrastructure companies and diversified ETFs that give you exposure to the clean energy transition without betting everything on a single commodity price cycle. Think of it like this: instead of panning for gold in a river, consider owning the shovels, the water rights, and the downstream processing plant. That’s where the durable value seems to be building in 2026.
얼마 전 한 독자분께서 이런 메시지를 보내왔어요. “전기차 관련주는 너무 올랐고, 이제 원자재 쪽으로 직접 들어가야 하는 거 아닌가요? 리튬이나 코발트가 궁금한데, 어디서부터 공부해야 할지 모르겠어요.” 사실 이 질문, 요즘 투자 커뮤니티에서 꽤 자주 나오는 얘기라고 봅니다. 전기차 보급률이 전 세계적으로 30%를 넘어서기 시작한 2026년, 배터리 핵심 원자재인 리튬과 코발트는 단순한 광물이 아니라 ‘에너지 패권의 열쇠’로 불리기 시작했으니까요. 오늘은 이 희귀금속 투자 트렌드를 함께 차근차근 뜯어보겠습니다.
📊 숫자로 보는 리튬·코발트 시장: 2026년 현재 상황
먼저 시장 규모부터 짚어보는 게 좋을 것 같아요. 2026년 1분기 기준, 글로벌 리튬 시장 규모는 약 920억 달러(한화 약 123조 원)에 달한다고 봅니다. 2022년 초 탄산리튬 가격이 1톤당 80만 위안을 찍으며 폭등했다가, 2023~2024년 공급 과잉으로 급락했던 사이클을 기억하시나요? 그 이후 구조조정이 진행되면서 2026년 현재는 1톤당 약 18만~22만 위안 수준에서 안정화되는 흐름이 감지되고 있어요.
코발트는 조금 다른 그림이에요. 콩고민주공화국(DRC)이 전 세계 공급량의 약 72%를 차지하는 구조적 집중 리스크가 여전한 상황에서, 2025년 하반기 DRC 정부의 수출 규제 강화 움직임이 2026년에도 이어지면서 코발트 가격은 톤당 약 3만 3천 달러 선으로 반등했습니다. 공급망 리스크가 곧 가격 프리미엄으로 이어지는 전형적인 희귀금속 패턴이라고 볼 수 있어요.
리튬 수요 전망: 전고체 배터리 상용화 본격화로 2027년까지 연 12~15% 수요 증가 예상
코발트 대체 움직임: LFP(리튬인산철) 배터리 점유율 확대로 코발트 수요 일부 대체 진행 중
리사이클링 시장 부상: 배터리 재활용 통한 ‘도시 광산’ 개념이 공급 변수로 등장
지정학적 리스크: 미·중 희귀금속 패권 경쟁이 가격 변동성을 키우는 핵심 요인
ESG 프리미엄: 윤리적 채굴 인증 광물에 대한 프리미엄 수요 증가
🌍 국내외 투자 사례: 누가 어떻게 움직이고 있나요?
해외 사례를 보면, 앨버말(Albemarle)과 SQM 같은 글로벌 리튬 메이저들은 2026년 현재 칠레 아타카마 염호 개발 확장에 속도를 내고 있어요. 특히 앨버말은 2026년 연간 생산량 목표를 20만 톤 이상으로 잡으면서 공격적 증설 기조를 유지하고 있습니다. 반면 코발트 분야에서는 글렌코어(Glencore)가 여전히 시장 지배력을 갖고 있으며, DRC 카모아-카쿨라 광산 확장을 통해 공급 주도권을 쥐려 하고 있다고 봐요.
국내 시장은 어떨까요? 포스코홀딩스는 아르헨티나 리튬 염호 프로젝트(‘포스코 리튬 솔루션’)를 통해 연산 10만 톤 규모의 수산화리튬 생산 체계를 구축해가고 있어요. LG에너지솔루션과 삼성SDI 역시 배터리 원자재 직접 확보 전략을 강화하면서, 단순 완성품 제조사에서 원자재 밸류체인 수직계열화 기업으로 전환을 꾀하고 있습니다. 개인 투자자 입장에서는 이런 기업들의 움직임을 간접적으로 추종하는 전략이 현실적인 접근이라고 봅니다.
💡 개인 투자자를 위한 현실적인 접근법
솔직히 말하면, 리튬이나 코발트 현물을 직접 사고파는 건 개인 투자자에게는 현실적으로 어렵습니다. 선물 시장은 변동성이 너무 크고, 현물은 보관·유통 자체가 문제죠. 그래서 대부분의 전문가들이 권하는 방식은 크게 세 가지라고 봐요.
관련 ETF 투자: ‘Global X Lithium & Battery Tech ETF(LIT)’, ‘Sprott Lithium Miners ETF(LITP)’ 등 해외 상장 ETF를 통한 분산 접근
국내 밸류체인 기업 투자: 포스코홀딩스, 에코프로비엠, 코스모화학 등 소재·정제 기업 직접 투자
분할 매수 전략: 희귀금속 가격 사이클은 수년 단위로 움직이므로 한 번에 몰빵보다 12~18개월 분할 매수가 리스크 완화에 효과적
다만 한 가지 꼭 짚고 싶은 건, 코발트의 경우 LFP 배터리 확대와 코발트 프리(Cobalt-free) 기술 개발이 중장기 수요를 잠식할 수 있다는 점이에요. 단기 공급 리스크로 가격이 오를 수 있지만, 기술 대체 리스크까지 감안한 투자 시계열을 갖는 게 중요하다고 봅니다.
에디터 코멘트 : 희귀금속 투자는 ‘자원을 사는 게 아니라 흐름을 사는 것’이라는 말이 딱 맞는 것 같아요. 리튬과 코발트 모두 단기 가격 등락보다는 전기차·전고체 배터리라는 큰 물줄기 안에서 어느 지점에 있는지 파악하는 게 먼저라고 봅니다. 지금 이 시점이 ‘공급 정상화 이후 수요 반등 구간’의 초입이라는 시그널이 여럿 보이는 만큼, 무리한 단타보다는 분할 매수와 ETF를 활용한 분산 전략으로 천천히 포지션을 쌓아가는 게 현명한 선택이 아닐까 싶어요. 투자는 항상 본인의 리스크 허용 범위 안에서 하시길 바랍니다.
Picture this: it’s early 2026, and a factory owner in Guangdong Province is staring at order sheets that are noticeably thinner than they were three years ago. His export partners in Europe are hesitant, domestic demand hasn’t fully bounced back, and the real estate sector — once the engine of China’s prosperity — is still working through its hangover. This isn’t just one man’s story. It’s a microcosm of what economists have been flagging for months: China’s era of blistering economic growth is decisively behind us, and the ripple effects are being felt from Seoul to São Paulo.
So let’s think through this together — what’s actually driving the slowdown, how bad could it get, and what does it mean for you, whether you’re an investor, a business owner, or just someone trying to make sense of the global economy in 2026?
The Numbers Don’t Lie: Unpacking China’s Growth Trajectory
For context, China averaged GDP growth rates north of 8–10% annually through much of the 2000s and 2010s. That kind of expansion was almost mythological in economic circles. Fast forward to 2026, and the International Monetary Fund (IMF) projects China’s GDP growth to hover around 4.2–4.5% for the year — a figure that would have seemed catastrophic a decade ago, even if it still outpaces most developed economies.
But raw percentage points don’t tell the whole story. Let’s break down the structural forces at play:
Property sector drag: The real estate market, which once accounted for roughly 25–30% of China’s GDP (directly and indirectly), is still digesting the fallout from the Evergrande-era debt crisis. New housing starts remain suppressed, and consumer confidence in property investment has not fully recovered.
Deflationary pressure: Unlike most of the world battling inflation, China has been wrestling with deflation — meaning prices are falling, which sounds nice but actually signals weak domestic demand and shrinking corporate profits.
Demographic headwinds: China’s population peaked and is now declining. A shrinking, aging workforce puts structural limits on productivity-driven growth — this is a decades-long challenge that no short-term stimulus can easily fix.
Geopolitical decoupling: Supply chain diversification strategies by the US, EU, and allied nations have meaningfully reduced China’s share of global manufacturing orders. “China Plus One” sourcing strategies are now standard boardroom vocabulary.
Youth unemployment: Urban youth unemployment in China has remained elevated — at times exceeding 15–18% in recent reporting periods — dampening the consumer spending that Beijing desperately needs to rebalance its economy.
Global Dominoes: Who Feels the Tremors?
Here’s where it gets really interesting for the rest of us. China is the world’s second-largest economy and the largest trading partner for over 120 countries. When its growth sneezes, plenty of economies catch a cold.
Resource-exporting nations like Australia, Brazil, and South Africa have historically been among the first to feel the pinch. Chinese demand for iron ore, copper, and soybeans drives commodity prices globally. A slower China means softer commodity markets — which is already showing up in 2026 export revenue figures for these countries.
Southeast Asian economies are experiencing a dual effect. On one hand, manufacturing migration away from China (to Vietnam, Indonesia, Thailand, and Malaysia) is a net positive for these nations. On the other hand, they’re still deeply integrated into Chinese supply chains and consumer markets, so a prolonged Chinese slowdown creates real headaches.
South Korea and Japan — two of China’s largest trade partners in the region — are navigating a careful balancing act. Korean semiconductor and electronics exports to China have already seen pressure, prompting Seoul to double down on market diversification toward the Middle East and Southeast Asia.
Is There a Silver Lining? Realistic Alternatives and Opportunities
Here’s where I want us to shift gears a bit — because doom and gloom only gets you so far. The slowdown is real, but it’s also creating genuine opportunities worth thinking about:
Emerging market reallocation: Investors are increasingly eyeing India, Indonesia, and Vietnam as alternative growth stories. India’s GDP growth is projected above 6.5% in 2026 — and its demographic dividend (a young, growing workforce) is exactly what China is losing.
Commodity price cooling: A slower China means softer energy and raw material prices globally. For import-heavy economies and everyday consumers, this can translate into lower production costs and more breathing room on inflation.
Supply chain resilience plays: Businesses that diversify their supplier base away from single-country dependency are proving more resilient. This is a headache in the short term but a strategic advantage in the medium term.
Chinese domestic consumption pivot: Beijing is actively pushing policies to boost domestic consumption — EVs, green technology, and services. Companies that align with these policy priorities (rather than fighting them) may find surprising growth pockets within China itself.
Technology decoupling creating niches: As Chinese tech companies build parallel ecosystems (especially in AI, EVs, and semiconductors), Western companies may find reduced competition in certain premium segments — or conversely, discover new partnership models.
What Should You Actually Do With This Information?
Whether you’re managing a portfolio, running a business with Chinese exposure, or just trying to understand why certain products might get pricier (or cheaper) in 2026, here’s a grounded framework for thinking about China’s slowdown:
First, don’t panic-sell or panic-pivot. Structural slowdowns play out over years, not quarters. Knee-jerk reactions usually cost more than they save. Second, diversify your exposure — both geographically and across sectors. Third, watch Beijing’s policy signals closely. The Chinese government has enormous fiscal and monetary tools at its disposal, and stimulus moves can shift sentiment quickly, even if they don’t fully reverse structural trends. Finally, think in decades, not headlines. China’s economy at 4% growth on a $18+ trillion GDP base is still generating enormous absolute wealth — it’s a slowdown, not a collapse.
Editor’s Comment : China’s economic story in 2026 is less about catastrophe and more about transition — from an investment-and-export-led model to something more consumption-driven and innovation-focused. That transition is messy, uneven, and disruptive for global markets. But transitions also create winners, and the smartest move is positioning yourself to understand the shift rather than just reacting to the headlines. Keep your curiosity sharp and your assumptions flexible — that’s the real edge in navigating a world where China is still enormously consequential, just in different ways than before.
얼마 전 한 지인이 이런 말을 했어요. “중국에 납품하는 공장 오더가 올 들어 눈에 띄게 줄었다”고요. 단순한 계절적 변동이려니 했는데, 이야기를 들으면 들을수록 그게 아닌 것 같다는 느낌이 들었습니다. 그 배경에는 지금 전 세계가 주목하고 있는 중국 경제 성장률 둔화라는 거대한 흐름이 자리하고 있었거든요.
2026년 현재, 중국 경제를 둘러싼 신호들은 복잡하게 얽혀 있어요. 단순히 ‘성장이 느려졌다’는 이야기가 아니라, 그 구조 자체가 바뀌고 있다는 점에서 우리 일상과도 꽤 가까운 문제라고 봅니다. 함께 천천히 짚어볼게요.
📉 숫자로 보는 현실: 중국 GDP 성장률의 궤적
중국은 2000년대 초반까지만 해도 연평균 10% 안팎의 고도성장을 구가했습니다. 그러나 이 수치는 꾸준히 낮아져 왔어요. 2023년 5.2%, 2024년 4.9%, 2025년에는 4.6% 수준에 머물렀고, 2026년 국제통화기금(IMF)과 세계은행(World Bank)의 공통된 전망치는 4.3~4.5% 구간에 집중돼 있는 상황입니다.
숫자만 놓고 보면 여전히 ‘높은 성장률’처럼 보이지만, 경제학에서는 이를 단순한 수치가 아닌 성장 모멘텀(momentum)의 관점으로 봐야 한다고 이야기해요. 추세적으로 하락하고 있다는 사실 자체가 중요한 시그널인 거죠.
특히 주목할 만한 수치들이 있어요:
부동산 투자 위축: 2026년 1분기 기준, 중국 부동산 개발 투자는 전년 동기 대비 약 8% 이상 감소한 것으로 추산됩니다. 헝다(Evergrande), 비구이위안(Country Garden) 사태 이후 민간 건설 투자 심리가 아직 회복되지 않은 상태예요.
청년 실업률 고공행진: 2025년 최고 21%를 넘어섰던 16~24세 청년 실업률은 2026년 들어 소폭 조정됐지만, 여전히 18% 내외로 구조적 문제로 자리 잡은 분위기입니다.
소비자물가 디플레이션 압력: CPI(소비자물가지수) 상승률이 0%대를 오가며 내수 침체의 우려가 지속되고 있어요. 물가가 안 오르는 게 왜 문제냐고요? 소비자들이 ‘지금 사지 않아도 나중에 더 싸게 살 수 있다’고 판단하면 소비 자체가 멈춰버리기 때문이에요.
수출 의존도 재확대: 내수 회복이 더디자 중국 정부는 수출 드라이브 정책을 다시 강화하고 있는데, 이는 미국·EU와의 무역 갈등 재점화로 이어지고 있습니다.
지방정부 부채 문제: 중국 지방정부의 숨겨진 부채, 이른바 ‘그림자 부채(shadow debt)’는 2026년 기준 약 60조 위안(한화 약 1경 1천조 원) 수준으로 추정되며, 재정 건전성에 심각한 우려를 낳고 있어요.
🌍 국내외 사례로 보는 구조적 둔화의 의미
사실 이런 흐름은 중국만의 이야기가 아니에요. 경제학자들은 이를 ‘중진국 함정(Middle Income Trap)’의 전형적인 패턴과 비교하곤 합니다. 1990년대 일본이 부동산 버블 붕괴 이후 ‘잃어버린 30년’으로 접어들었던 과정, 그리고 한국이 1997년 외환위기 이후 성장 구조를 근본적으로 재편해야 했던 과정과 맥락이 닿아 있다는 시각도 있어요.
특히 일본과의 비교는 흥미롭습니다. 일본은 1980년대 말 버블 정점 당시 GDP 대비 부동산 자산 비율이 극도로 높아졌고, 이후 자산 디플레이션이 소비 전반으로 번지는 악순환을 경험했어요. 중국 역시 GDP 대비 부동산 관련 자산의 비중이 과도하게 높다는 점에서, 일부 경제학자들은 ‘중국판 잃어버린 10년’ 가능성을 조심스럽게 언급하고 있는 상황이에요.
국내적으로도 영향은 명확하게 나타나고 있어요. 한국의 대중(對中) 수출 비중은 여전히 전체 수출의 약 19~20%를 차지하고 있어요. 중국 내수가 위축되면 우리 반도체, 화학, 소비재 수출에도 직격탄이 올 수 있다는 건데, 실제로 2025년부터 일부 중간재 품목에서 그 영향이 감지되기 시작했다고 봅니다.
🔍 중국 정부는 지금 무엇을 하고 있나
중국 당국도 손을 놓고 있지는 않아요. 2025년 하반기부터 본격화된 경기 부양책들이 2026년에도 이어지고 있는데요, 크게 세 가지 방향으로 나뉩니다.
재정 확장 정책: 인프라 투자 확대를 위한 특별 국채 발행을 지속하고 있어요. 다만 ‘어디에 짓느냐’가 문제예요. 수요가 없는 지역에 인프라를 깔면 효율이 낮을 수밖에 없거든요.
소비 진작 캠페인: 가전제품·자동차 보조금 지원 정책을 연장하며 내수를 자극하려 하고 있지만, 소비자 신뢰 회복까지는 시간이 걸린다는 평가가 많습니다.
첨단산업 육성: 전기차(EV), 배터리, AI, 반도체 등 미래 산업에 국가 자원을 집중하는 전략을 강화하고 있어요. 이 분야에서는 단기 성장보다 장기 경쟁력을 노리는 거라고 볼 수 있어요.
이러한 정책들이 얼마나 효과를 낼지는 아직 미지수예요. 구조적 문제를 단기 부양책만으로 해결하기 어렵다는 건, 경제사가 이미 여러 차례 보여준 교훈이기도 하니까요.
💡 우리는 어떻게 대응할 수 있을까
중국 경제의 둔화는 분명히 위험 요인이지만, 반드시 재앙만은 아닐 수도 있어요. 오히려 이 변화를 읽고 선제적으로 움직이는 개인이나 기업에게는 기회가 될 수 있다고 봅니다.
수출 의존 기업 관련 투자자라면: 중국 매출 비중이 높은 기업의 리스크를 재점검해 볼 시점이에요. 특히 중국 내수 소비재 관련 종목은 보수적으로 접근하는 게 현실적인 것 같습니다.
자영업·소상공인이라면: 중국산 원자재나 부품 의존도가 높다면, 공급망 다변화 시나리오를 미리 그려두는 게 좋을 것 같아요. 동남아, 인도 등 대체 공급망이 현실적인 선택지가 되고 있어요.
일반 소비자라면: 당장 큰 변화를 느끼기 어렵겠지만, 수입 물가나 특정 품목의 가격 변동성이 높아질 수 있어요. 큰 소비 결정(가전, 자동차 등)은 시장 흐름을 보며 신중하게 접근하는 게 좋을 것 같습니다.
커리어 관점에서 본다면: 중국 특수에 기대던 산업보다는, 인도·동남아·중동 등 신흥 시장을 커버할 수 있는 역량을 키우는 방향이 중장기적으로 유리할 수 있어요.
결국 중국 경제의 둔화는 ‘끝’이 아니라 ‘전환’에 가깝다고 봐요. 세계 2위 경제 대국이 고속 성장에서 질적 성장으로 패러다임을 바꾸는 과정, 그 진통을 우리가 어떻게 읽고 활용하느냐가 관건인 것 같습니다.
에디터 코멘트 : 중국 경제를 단순히 ‘잘된다, 못된다’의 이분법으로 보는 시각은 이제 좀 내려놓을 때가 된 것 같아요. 4%대 성장도 절대적 규모로 보면 어마어마한 숫자예요. 다만 구조적 체질이 바뀌고 있다는 점, 그리고 그 변화의 파장이 우리 경제 곳곳에 스며들고 있다는 점은 분명히 주시해야 한다고 봅니다. 거창한 대비책보다는, 내 주변의 작은 변화 신호들을 꾸준히 읽어가는 습관이 가장 현실적인 리스크 관리 아닐까요? 😊
Picture this: it’s early 2026, and a copper miner in Chile is staring at a spreadsheet that looks completely different from what it showed six months ago — not because copper demand changed dramatically, but because the US dollar shifted. Meanwhile, a soybean farmer in Brazil is quietly celebrating. Same crops, same harvest, wildly different outcomes. That’s the invisible hand of dollar dynamics at work, and if you’re not paying attention to it, you’re leaving serious money on the table — or walking blindly into loss.
Let’s think through this together, because the relationship between dollar strength/weakness and commodity prices is one of the most misunderstood levers in global finance.
Why the Dollar and Commodities Are in a Constant Tug-of-War
Almost all major commodities — crude oil, gold, copper, soybeans, wheat — are priced in US dollars on global markets. This creates a mechanical inverse relationship: when the dollar strengthens, those same commodities become more expensive for buyers using other currencies, so demand tends to fall, pushing prices down. When the dollar weakens, commodities become relatively cheaper for foreign buyers, stimulating demand and pushing prices up.
Think of it like a seesaw. The dollar sits on one end; commodity prices sit on the other. But — and this is crucial — it’s not a perfectly balanced seesaw. Other factors like supply disruptions, geopolitical tensions, and seasonal demand can overpower the currency effect. Still, in 2026, with the Federal Reserve navigating a delicate rate-cut cycle after the aggressive tightening of recent years, dollar volatility is higher than it’s been in nearly a decade, making this relationship more impactful than ever.
The Numbers Tell a Clear Story
Let’s anchor this in some data. The DXY index (which measures the dollar against a basket of six major currencies) peaked around 107 in late 2025 and has since softened toward the 101–103 range as of early April 2026, reflecting growing market expectations of Fed easing. Here’s what that shift has done to key commodities:
Gold: Gold has climbed back above $2,900/oz in early 2026, partly driven by dollar softening. Gold is the textbook dollar-inverse asset — when the dollar loses purchasing power, gold absorbs safe-haven demand.
Crude Oil (WTI): A softer dollar has provided a tailwind for oil prices, supporting prices in the $78–$85/barrel range despite relatively stable OPEC+ production targets. Non-US buyers find oil more affordable, boosting demand signals.
Copper: Copper, often called “Dr. Copper” for its economic forecasting ability, has benefited from both dollar softening and China’s 2026 infrastructure stimulus. Prices have been testing the $4.50–$4.80/lb range — a meaningful move from late 2025 lows.
Agricultural commodities (wheat, soybeans): A weaker dollar has boosted US agricultural exports’ competitiveness, supporting prices after a rough 2025 season driven by oversupply concerns.
Natural gas: More influenced by regional supply/demand dynamics, but dollar softening has amplified LNG export demand from Asia and Europe.
Real-World Examples: Who Wins, Who Loses
Brazil’s Agri-Export Boom: Brazil’s agricultural exporters are arguably the biggest beneficiaries of a weaker dollar environment. When the dollar falls, the Brazilian real relatively strengthens, which sounds bad for exporters — but since commodities are priced in dollars and Brazil earns dollars, the effective purchasing power of their revenue in local terms remains robust. In Q1 2026, Brazilian soybean exports hit a record quarterly pace, partly fueled by strong Chinese import demand encouraged by better dollar-denominated pricing.
South Korean & Japanese Manufacturers Getting Squeezed: On the flip side, countries that import raw materials priced in dollars face a different calculus. South Korean steelmakers and Japanese automakers, who import iron ore and aluminum in dollars, actually prefer a stronger dollar environment when their own currencies are relatively strong — it reduces their import bill. In early 2026, the yen’s modest recovery against the dollar has provided some relief to Japanese manufacturers who were brutally squeezed in 2024–2025.
Middle Eastern Oil Producers: OPEC nations, particularly Saudi Arabia with its dollar-pegged riyal, don’t directly benefit from dollar weakness in currency terms — they always receive dollars. But a weaker dollar can stimulate global oil demand, indirectly supporting the volume and price environment they operate in.
US Domestic Energy Sector: American oil and gas companies operate in a nuanced space. A weaker dollar can boost commodity prices (good for revenue), but it also raises the cost of imported equipment and services. The net effect in 2026 has generally been positive for US E&P (exploration and production) companies, as higher commodity prices have outweighed cost pressures.
The Complicating Factors You Can’t Ignore
Here’s where I want to be really honest with you: the dollar-commodity relationship is real, but it’s not a simple on/off switch. Several factors complicate the picture in 2026 specifically:
Geopolitical risk premium: Ongoing tensions in the Middle East and continued uncertainty around Eastern European energy infrastructure mean oil and gas carry a geopolitical premium that can override dollar dynamics.
China’s demand cycles: China consumes roughly 50–60% of the world’s base metals. When China’s economy sneezes, copper and aluminum catch a cold regardless of what the dollar is doing. The 2026 stimulus package has been supportive, but execution risks remain.
Fed policy uncertainty: Markets have been pricing in 2–3 rate cuts in 2026, but stronger-than-expected inflation data could reverse those expectations quickly, sending the dollar surging and commodity prices tumbling. Always watch the Fed dot plot.
Supply shocks: No currency analysis could have predicted the 2024 Red Sea shipping disruptions’ impact on energy prices. Black swan supply events can dominate currency effects entirely.
Realistic Alternatives: How to Position Yourself in This Environment
Whether you’re an investor, a small business owner with supply chain exposure, or just someone trying to make smarter financial decisions, here’s how to think practically about this:
If you’re an investor concerned about inflation: A softening dollar environment in 2026 makes a modest allocation to commodities (through ETFs like DJP or diversified commodity funds) or gold a reasonable hedge. Don’t go overboard — think 5–10% of a portfolio, not a wholesale pivot.
If you run a business that imports raw materials: Consider forward contracts or currency hedging instruments. A 3–6 month forward hedge on your dollar-denominated material purchases can smooth out volatility significantly. Talk to a treasury specialist or your bank’s FX desk — this is standard practice, not exotic finance.
If you’re in agriculture (especially export-focused): A weaker dollar is your friend right now, but don’t get complacent. Use this window to lock in favorable contract prices with overseas buyers while currency conditions support your competitiveness.
If you’re a cautious observer: At minimum, start tracking the DXY index alongside commodity price news. It takes 5 minutes a week and completely changes how you interpret price movements. Free tools like TradingView or even Google Finance make this accessible.
The key takeaway here isn’t to become a forex trader overnight. It’s to recognize that commodity prices don’t move in a vacuum — they’re always whispering something about the dollar, and if you learn to listen, you’ll make far better decisions in purchasing, investing, and planning.
The dollar’s current trajectory in 2026 — gradually softening as the Fed cautiously pivots — creates a real window for commodity-exposed sectors and investors. But that window has a timer on it. Stay curious, stay hedged, and revisit your assumptions every quarter.
Editor’s Comment : The dollar-commodity relationship is one of those foundational concepts that rewards the people who take time to truly understand it — not just memorize the inverse rule, but internalize why it works and when it breaks down. In 2026’s shifting macro environment, that understanding isn’t just intellectually satisfying; it’s genuinely actionable. Whether you’re protecting a business margin or just trying to understand why your grocery bill keeps changing, the dollar is always part of the conversation.
얼마 전 지인이 이런 말을 하더라고요. “뉴스에서 달러가 강세라고 하는데, 왜 갑자기 기름값이랑 금값이 떨어지는 거야?” 처음엔 단순한 궁금증처럼 들렸지만, 사실 이 질문 안에는 글로벌 금융 시장의 핵심 메커니즘이 통째로 담겨 있어요. 달러와 원자재 가격의 관계, 알고 보면 생각보다 훨씬 촘촘하게 연결되어 있답니다.
2026년 현재, 미국 연방준비제도(Fed)의 금리 정책 변화와 함께 달러 인덱스(DXY)가 요동치면서 국제 원자재 시장도 덩달아 큰 파도를 맞고 있어요. 오늘은 이 관계를 하나씩 풀어보면서, 실생활에 어떤 영향을 미치는지까지 함께 살펴보려고 합니다.
① 달러와 원자재 가격, 왜 반대로 움직일까?
원자재(Commodity)는 국제 시장에서 대부분 미국 달러(USD)로 가격이 표시됩니다. 원유(WTI, 브렌트유), 금(Gold), 구리, 밀, 대두 등 거의 모든 원자재가 달러 기준으로 거래되죠. 이게 바로 달러와 원자재 가격이 서로 역(逆)의 관계를 갖게 되는 근본적인 이유예요.
쉽게 풀어보면 이렇습니다. 달러 가치가 오르면(달러 강세), 달러 이외 통화를 쓰는 나라들 입장에서는 같은 원자재를 사기 위해 더 많은 자국 화폐를 써야 해요. 수요가 줄어드는 거죠. 반대로 달러 가치가 내리면(달러 약세), 다른 나라들의 구매력이 올라가면서 원자재 수요가 늘고 가격도 상승 압력을 받습니다.
실제 수치로 보면 더 명확해요. 2026년 1분기 기준, 달러 인덱스(DXY)가 약 104~108 구간을 오가는 동안 국제 금 선물 가격은 트로이온스당 약 2,950~3,100달러 사이에서 역방향 흐름을 보였습니다. 달러가 108에 근접할 때 금값은 2,950달러 아래로 눌렸고, DXY가 104 초반으로 내려앉을 때 금값은 3,100달러를 넘보는 패턴이 반복됐어요. 물론 100% 정비례 반비례는 아니지만, 상관관계가 꽤 뚜렷하다고 봅니다.
② 원자재별로 달러 민감도가 다르다
달러의 영향을 받는 건 맞지만, 원자재마다 민감도가 조금씩 달라요. 이 점을 놓치면 “달러 강세인데 왜 구리값은 오르지?” 같은 혼란이 생길 수 있어요.
금(Gold): 달러 약세 수혜를 가장 크게 받는 자산이에요. 안전자산 성격과 인플레이션 헤지 수단이라는 이중 역할 덕분에, 달러가 흔들릴 때 금 수요는 급등하는 경향이 있습니다.
원유(Crude Oil): 달러 민감도가 높지만, OPEC+ 감산 정책, 지정학적 리스크, 계절적 수요 변동 등 변수가 많아서 달러만으로 가격을 설명하기엔 한계가 있어요.
구리(Copper): ‘닥터 코퍼’라는 별명답게 글로벌 경기 선행 지표로 불려요. 중국의 인프라 투자 및 제조업 PMI 지수의 영향을 달러 못지않게 크게 받습니다.
농산물(소맥·대두·옥수수): 달러 영향 외에도 라니냐·엘니뇨 같은 기후 요인, 주요 생산국의 수출 정책이 가격에 복합적으로 작용해요.
리튬·희토류: 전기차 배터리 공급망과 직결되어 있어, 달러보다 기술 산업 수요와 중국의 수출 통제 정책에 더 민감하게 반응하는 라인이에요.
③ 2026년 국내외 실제 사례로 보는 달러-원자재 연동 효과
2026년 초, 미국 Fed가 금리 인하 속도를 조절하겠다는 신호를 내보내면서 달러 강세 기조가 이어졌어요. 이때 국제 유가(브렌트유 기준)는 배럴당 70달러 초중반에서 횡보했는데, 달러 강세로 인한 하방 압력을 OPEC+의 감산 연장이 상쇄하는 구도가 만들어졌죠. 두 힘이 팽팽하게 맞서는 전형적인 사례라고 볼 수 있어요.
국내에서는 이런 흐름이 원/달러 환율을 통해 이중으로 충격을 줘요. 예를 들어 달러 강세 → 원/달러 환율 상승(원화 약세) → 달러 표시 원자재를 수입할 때 원화 지출 증가라는 구조가 형성됩니다. 2026년 1분기 원/달러 환율이 1,420~1,460원 구간에서 움직이는 동안, 국내 정유사들의 원재료 조달 비용이 전년 동기 대비 눈에 띄게 늘었다는 분석이 나왔어요. 소비자 입장에서는 주유소 기름값이 떨어지기 어려운 이유 중 하나가 바로 이 환율 효과입니다.
④ 달러 약세 시나리오에서의 기회와 리스크
반대 방향도 생각해볼게요. 만약 Fed가 공격적인 금리 인하로 방향을 튼다면? 달러 약세 국면에서는 원자재 전반에 상승 압력이 가해지고, 특히 금·은 같은 귀금속이나 에너지 원자재가 강세를 보이는 경우가 많아요. 신흥국 통화는 상대적으로 강세를 보이고, 원자재 수출국들의 경기도 개선되는 경향이 있습니다.
다만 달러 약세가 곧 인플레이션 재점화 신호일 수 있다는 점은 유의해야 해요. 원자재 가격 상승 → 제조원가 상승 → 소비재 가격 상승이라는 연쇄 반응이 이어질 수 있거든요. 투자 기회가 될 수도 있지만, 생활 물가 측면에서는 부담이 될 수 있는 양날의 검인 셈이에요.
⑤ 우리가 취할 수 있는 현실적인 대응 전략
달러와 원자재의 관계를 이해했다면, 이걸 실생활과 자산 관리에 어떻게 연결할 수 있을까요?
달러 강세 국면: 달러 예금 또는 달러 ETF를 통한 환차익 가능성 검토. 원자재 직접 투자보다는 원자재 관련 기업 주식(에너지 대기업, 광산업체 등)을 살펴보는 것도 방법이에요.
달러 약세 전환 예상 시: 금 ETF, 원자재 인덱스 펀드, 혹은 리츠(REITs)처럼 실물 자산 연계 상품으로 포트폴리오 다변화를 고려해볼 수 있어요.
자영업자·중소기업: 원자재 수입 비용이 핵심인 업종이라면, 환 헤지(환율 위험 회피) 상품을 적극적으로 활용하는 게 안전하다고 봅니다.
일반 소비자: 달러 강세 → 수입 물가 상승 가능성을 미리 인지하고, 연료비·식품 원재료가 많이 들어가는 소비를 유연하게 조절하는 게 현실적인 대응이에요.
에디터 코멘트 : 달러와 원자재의 관계는 “교과서적 반비례”라고 단정 짓기보다, 상황에 따라 달라지는 복합적인 함수라고 이해하는 게 맞는 것 같아요. 지정학, 공급망, 기후, 각국의 통화 정책이 모두 변수로 작용하거든요. 그래도 기본 원리—달러가 강하면 원자재는 눌리고, 달러가 약하면 원자재는 들썩인다—를 머릿속에 넣어두는 것만으로도 경제 뉴스가 훨씬 입체적으로 읽히기 시작한답니다. 완벽한 예측보다, 큰 흐름을 읽는 눈을 기르는 게 우선이라고 봐요.
Picture this: it’s early 2026, and a mid-sized electronics manufacturer in South Korea is quietly renegotiating contracts with its Chinese supply chain partners. Not because of a falling out — but because orders from Chinese consumers have softened, and the ripple effects are making their way across borders faster than anyone anticipated. This isn’t a hypothetical. It’s the kind of quiet economic tremor that happens when the world’s second-largest economy starts losing steam.
China’s GDP growth rate, which hovered around 5.2% in recent years, is now projected by the IMF and World Bank to settle closer to 4.3–4.6% through 2026 — a number that sounds modest on paper, but carries enormous weight when you consider that China accounts for roughly 18% of global GDP. So let’s think through this together: what’s really happening, why it matters, and — most importantly — what realistic alternatives exist for businesses and individuals navigating this shift.
📊 Breaking Down the Numbers: Why Growth Is Slowing
China’s economic deceleration isn’t a sudden collapse — it’s a structural transition that economists have been flagging for years. Here’s what the data tells us in 2026:
Real estate sector drag: The property sector, which once contributed nearly 25–30% of China’s GDP (directly and indirectly), continues to contract. Major developers like Evergrande and Country Garden triggered a cascade that still suppresses domestic investment confidence.
Deflationary pressure: China’s CPI (Consumer Price Index) has been flirting with deflation — a sign that domestic demand remains weak. When consumers expect prices to fall, they delay spending, creating a self-reinforcing cycle.
Demographic headwinds: China’s working-age population is shrinking. With a fertility rate of approximately 1.0–1.1, the labor force contraction is now measurable in economic output terms.
Export competitiveness under pressure: U.S. and EU tariffs — including the sustained tariff regimes from 2025–2026 — have pushed Chinese export volumes lower, particularly in electronics, EVs, and solar panels.
Youth unemployment: Urban youth unemployment in China reached alarming levels (peaking above 20% in recent years), signaling a mismatch between educational output and labor market demand.
🌍 Global Ripple Effects: Who Feels It Most?
Here’s where it gets genuinely interesting — and a bit sobering. China’s slowdown doesn’t stay inside its borders. Think of it like a stone dropped in a pond: the waves travel outward, and some shores feel them harder than others.
Southeast Asia is experiencing a dual dynamic. On one hand, countries like Vietnam and Indonesia are benefiting from supply chain diversification as companies move manufacturing out of China (the so-called “China Plus One” strategy). On the other hand, these same nations export raw materials and intermediate goods to China — and those orders are shrinking.
South Korea and Japan, both deeply integrated into China’s supply chain ecosystem, are among the most exposed. South Korea’s semiconductor and chemical exports to China have faced measurable volume declines. Japan’s luxury goods and automotive sectors — once buoyed by Chinese middle-class demand — are recalibrating their forecasts for 2026.
Australia and Brazil, as major commodity exporters (iron ore, soybeans, copper), are watching Chinese industrial demand closely. A slowdown in Chinese construction and manufacturing translates directly into softer commodity prices — which hits their fiscal revenues hard.
Germany, Europe’s industrial engine, has seen its automotive giants (BMW, Mercedes-Benz, Volkswagen) report declining Chinese market share as local EV competitors like BYD dominate domestically. This isn’t just a market share story — it’s a structural repositioning of global automotive leadership.
💡 Realistic Alternatives: Adapting Rather Than Waiting
Okay, so we’ve established that the slowdown is real and the effects are wide-reaching. But here’s my honest take: panic is not a strategy. Let’s talk about what actually works.
For businesses:
Diversify supply chains now, not later. The “China Plus One” approach — maintaining a Chinese base while building capacity in India, Vietnam, or Mexico — is no longer optional. It’s risk management 101 in 2026.
Pivot toward domestic demand in growth markets. India’s consumer class is expanding rapidly. Southeast Asian middle-class growth is accelerating. These aren’t replacements for China — but they’re meaningful hedges.
Invest in automation and nearshoring. As labor arbitrage advantages in China diminish, the calculus for nearshoring to Eastern Europe or Latin America is increasingly favorable for European and American firms respectively.
For individual investors and lifestyle planners:
Reconsider commodity-heavy portfolio exposure. If your investments are concentrated in Australian mining stocks or Brazilian agribusiness, a China demand slowdown deserves a place in your risk assessment.
Watch the currency dynamics. A weaker Chinese yuan (CNY) affects everything from travel costs to import prices in your home country. Understanding this helps you make smarter purchasing and travel timing decisions.
Opportunity in dislocation: Sectors being “pushed out” of China — like semiconductor manufacturing or pharmaceutical ingredients — are receiving massive government subsidies in the U.S., EU, and India. These can represent genuine growth opportunities for forward-looking investors.
🔮 The Bigger Picture: Transition, Not Collapse
It’s worth stepping back and being precise here. China slowing from 8% growth to 4.5% growth is not the same as a recession. It’s a maturing economy undergoing structural transition — similar in some ways to what Japan experienced in the 1990s, though with key differences in government response capacity. Beijing still has significant policy levers: fiscal stimulus, state-directed investment, and monetary easing. The question is whether those levers can counteract structural headwinds — and most economists in 2026 are cautiously skeptical that they can fully offset them.
What this means practically: we’re not entering a world without Chinese economic influence. We’re entering a world where that influence is slower-growing, more contested, and increasingly internalized as China focuses on self-sufficiency in key sectors.
Editor’s Comment :China’s economic slowdown in 2026 is one of those macro-level shifts that can feel abstract until it shows up in your monthly supply costs, your investment portfolio, or the price of electronics at your local store. The smartest move isn’t to predict exactly how it unfolds — even the IMF gets that wrong regularly — but to build flexibility into your decisions. Whether you’re a business owner, an investor, or simply someone trying to make sense of a complex world, understanding the “why” behind these numbers gives you a genuine edge. Stay curious, stay diversified, and remember: disruption almost always contains opportunity if you’re looking in the right direction.