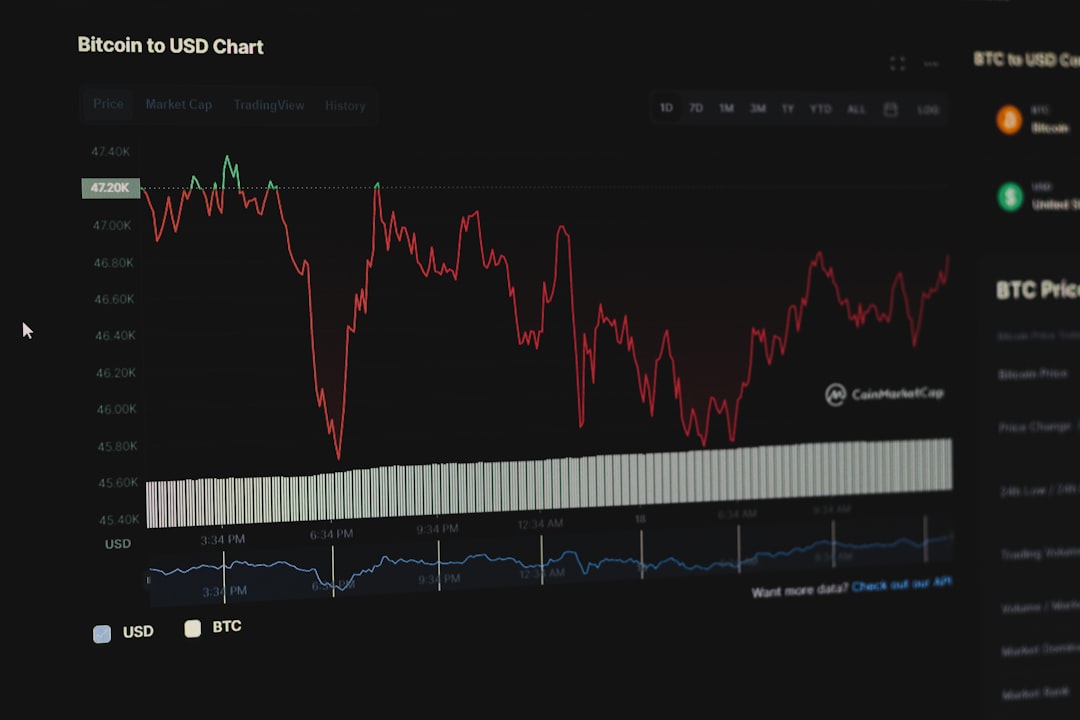
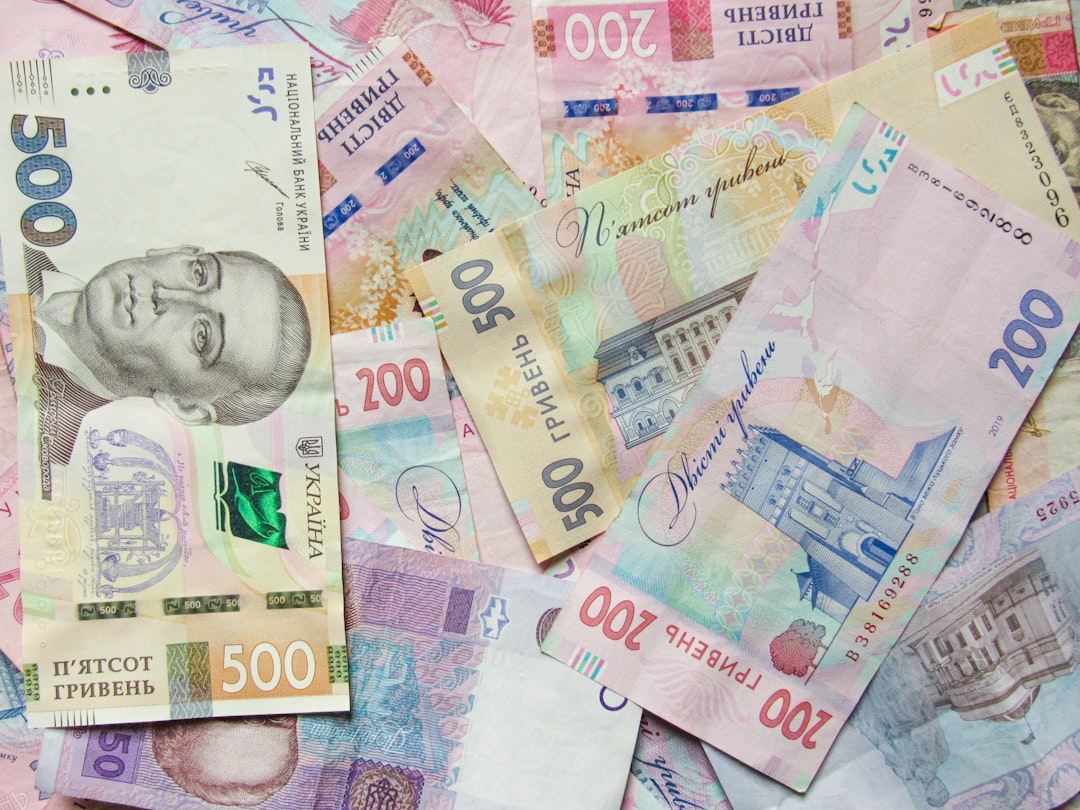
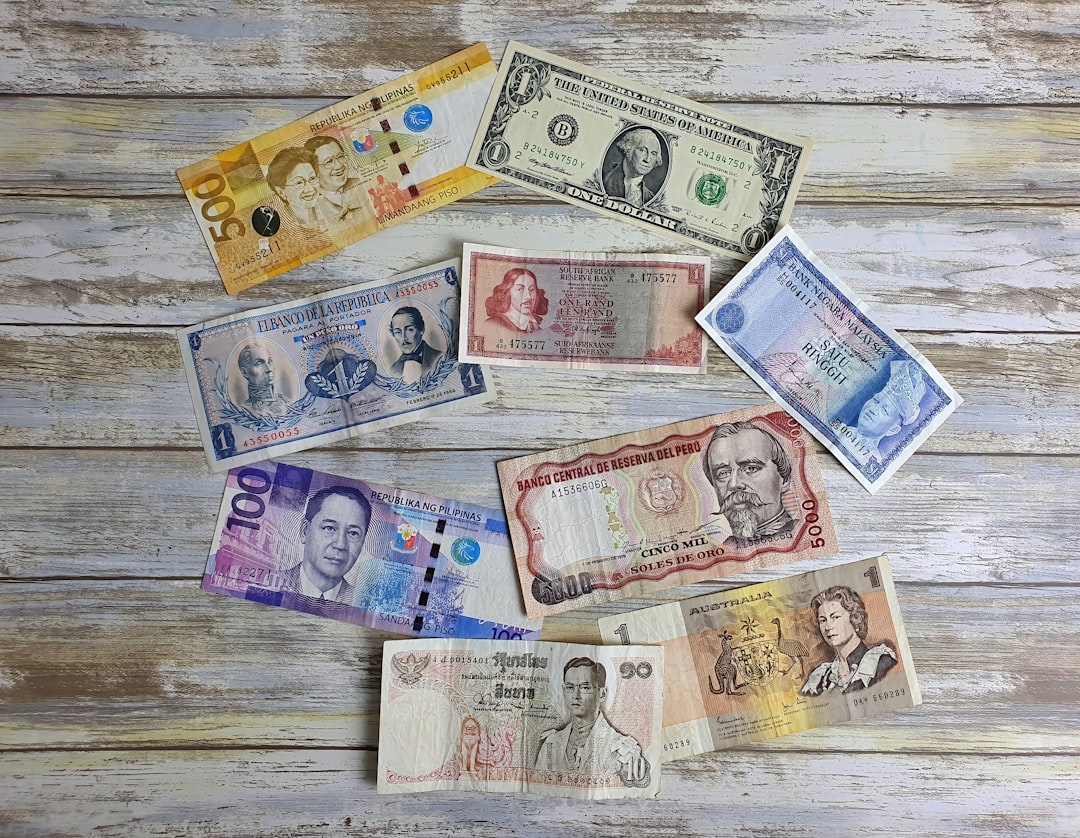
2026년 초, 미국 연방준비제도(Fed)가 기준금리를 또 한 번 조정한다는 소식이 들려왔을 때, 많은 투자자들이 스마트폰 화면을 붙잡고 주식 앱을 새로고침했을 겁니다. ‘금리 올린다는데 지금 팔아야 하나? 아니면 버텨야 하나?’ — 이런 고민, 한 번쯤은 해보셨을 것 같아요. 중앙은행의 통화정책이 발표될 때마다 주식시장이 출렁이는 현상, 단순한 심리적 반응일까요, 아니면 구조적인 메커니즘이 작동하는 걸까요? 오늘은 이 둘의 관계를 좀 더 깊이 들여다보려 합니다.
📊 숫자로 먼저 보는 금리와 주가의 관계
통화정책과 주식시장의 상관관계를 이해하려면, 먼저 할인율(Discount Rate)이라는 개념을 짚고 넘어가야 합니다. 주식의 이론적 가치는 미래에 발생할 현금흐름을 현재 가치로 환산한 것인데, 이때 할인율로 기준금리가 사실상 기준점 역할을 합니다. 금리가 오르면 미래 수익의 현재가치가 줄어들고, 자연스럽게 주가에 하방 압력이 생기는 구조라고 볼 수 있습니다.
실제 수치를 보면 더 명확해집니다:
2022년 미국 금리 인상 사이클: Fed가 2022년 3월부터 불과 16개월 만에 기준금리를 0.25%에서 5.25~5.50%까지 끌어올렸고, 같은 기간 S&P500 지수는 고점 대비 약 25% 하락했습니다.
2020년 제로금리 선언 이후: Fed가 금리를 0%대로 낮추자 S&P500은 2020년 3월 저점에서 2021년 말까지 약 110% 이상 급등했습니다. 유동성이 위험자산으로 쏠린 대표적인 사례입니다.
2024~2026년 금리 인하 사이클: 2024년 하반기부터 시작된 Fed의 점진적 금리 인하 기조는 나스닥과 S&P500의 재상승 모멘텀을 지지하는 주요 요인 중 하나로 꼽히고 있습니다. 2026년 현재, 시장은 연내 추가 1~2회의 인하 가능성을 여전히 반영 중인 것으로 보입니다.
물론 이 상관관계가 항상 선형적으로 작동하지는 않습니다. 기대(Expectation)가 이미 가격에 반영되어 있는 경우, 실제 금리 결정 발표 당일에는 오히려 반대 방향으로 움직이는 ‘소문에 사고 뉴스에 팔아라(Buy the rumor, sell the news)’ 현상도 빈번하게 나타납니다.
🌐 국내외 사례로 보는 통화정책의 주식시장 파급 경로
통화정책이 주식시장에 영향을 미치는 경로는 크게 세 가지 채널로 나눠볼 수 있을 것 같습니다.
① 유동성 채널(Liquidity Channel)
중앙은행이 금리를 낮추거나 양적완화(QE)를 실시하면 시중에 돈이 풀립니다. 예금 금리가 낮아지면 채권·예금보다 주식의 상대적 매력이 높아지고, 투자자들은 자연스럽게 위험자산으로 이동합니다. 일본은행(BOJ)은 마이너스 금리 정책을 오랫동안 유지하면서 자국 증시인 닛케이225의 구조적 지지 요인을 제공했다는 분석이 많습니다.
② 기업 수익성 채널(Earnings Channel)
금리가 오르면 기업의 차입 비용(이자 부담)이 늘어납니다. 특히 부채 비율이 높은 기업들은 이익이 직접적으로 침식됩니다. 반대로 금리 인하는 기업의 EBITDA 마진 개선에 기여하죠. 한국의 경우 2022~2023년 한국은행의 빠른 금리 인상 기간 동안 부채비율이 높은 중소형 건설·부동산 관련주들이 코스닥 내에서 특히 큰 타격을 받은 바 있습니다.
③ 환율 채널(Exchange Rate Channel)
미국이 금리를 올리면 달러 강세 압력이 생기고, 신흥국(한국 포함)에서 외국인 자금이 이탈하는 경향이 있습니다. 2022년 원/달러 환율이 1,400원대를 돌파하면서 코스피가 동반 하락한 것이 대표적인 예입니다. 2026년 현재도 글로벌 투자자들이 ‘달러 인덱스(DXY)’와 코스피 외국인 수급을 함께 모니터링하는 이유가 바로 여기에 있습니다.
⚠️ 상관관계의 함정 — 항상 맞지 않는 이유
그렇다면 금리가 내리면 무조건 주식을 사면 되는 걸까요? 그렇게 단순하지 않다는 것이 이 주제의 묘미입니다. 금리 인하가 ‘경기 침체에 대한 공포’ 때문에 단행된 경우라면, 오히려 주식시장은 더 빠르게 하락하기도 합니다. 2001년 닷컴버블 붕괴, 2008년 금융위기 당시 Fed는 금리를 공격적으로 낮췄지만 주가는 지속 하락했습니다. 이른바 ‘나쁜 금리 인하(Bad Rate Cut)’ 시나리오입니다.
반대로 경기가 충분히 과열되어 있고 기업 이익이 견고한 상황에서의 금리 인상은 ‘건강한 경제를 반영하는 신호’로 해석되어 주가에 크게 악영향을 주지 않을 수도 있습니다. 결국 중요한 것은 금리의 방향 그 자체보다, 그 금리 변화가 어떤 경제 맥락에서 이루어지는가라고 봅니다.
💡 2026년 현재, 투자자가 실질적으로 활용할 수 있는 전략
FOMC 회의 일정 캘린더 관리: 연 8회 예정된 Fed 회의 전후 변동성을 미리 인지하고, 단기 포지션 규모를 조절하는 것만으로도 불필요한 리스크를 줄일 수 있습니다.
섹터 로테이션 전략: 금리 인하 초기에는 성장주(기술·바이오), 금리 인상 환경에서는 가치주(금융·에너지)가 상대적으로 강세를 보이는 경향이 있습니다. 거시 환경 변화에 따라 ETF를 활용한 섹터 조정을 고려해 볼 만합니다.
채권-주식 혼합 포트폴리오: 금리 상승기에 채권 가격은 하락하지만, 금리 하락 전환 시점에 채권과 주식의 동반 상승 효과를 노리는 ‘바벨(Barbell) 전략’도 유효한 접근입니다.
한국은행 통화정책 방향성 추적: 미국 Fed만큼이나 한국은행 금통위 결정이 코스피·코스닥에 직접적 영향을 줍니다. 2026년 한은의 금리 방향성을 정기적으로 체크하는 것을 습관화하면 좋을 것 같습니다.
과잉 반응 구간 포착: 시장이 금리 발표에 단기적으로 과잉 반응하는 구간(예: 예상대로 나왔는데도 급락하는 경우)은 오히려 매수 기회가 되기도 합니다. ‘시장의 공포 지수(VIX)’를 병행해서 보는 것을 추천합니다.
통화정책과 주식시장의 관계는 단순한 공식이 아니라, 경제 심리와 구조적 메커니즘이 복합적으로 얽힌 동태적 시스템에 가깝습니다. 공식을 외우기보다는 ‘왜 이런 결과가 나오는지’를 이해하려는 노력이 장기적으로 훨씬 더 나은 투자 판단을 만들어 준다고 생각합니다.
에디터 코멘트 : 금리 발표날 마다 마음이 쫄깃해지는 건 저도 마찬가지예요. 하지만 중요한 건 그날의 반응보다 ‘그 금리 변화가 어떤 경제 스토리의 일부인가’를 읽는 시각입니다. 거시경제의 큰 흐름을 이해하는 투자자는 단기 노이즈에 흔들리지 않는 법이니까요. 2026년에도, 숫자 뒤에 있는 맥락을 읽는 안목을 함께 키워봐요.
A friend of mine — a mid-career professional in her late 30s — told me last year that she’d put nearly 80% of her savings into tech stocks. “It always went up,” she said. Then came the sector rotation of early 2026, and her portfolio took a serious hit. What she hadn’t considered was the quiet, steady world of commodities: agricultural products, energy assets, and industrial metals. These aren’t glamorous, but when volatility strikes, they often move to a different beat entirely. Let’s think through this together.
Why Commodities Deserve a Seat at Your Table in 2026
Commodities have historically served as a hedge against inflation and currency devaluation — and in 2026, that relevance hasn’t diminished one bit. Global supply chains are still recalibrating after years of disruption, geopolitical tensions continue to influence energy prices, and the green energy transition is creating unprecedented demand for specific metals like lithium, cobalt, and copper.
According to the Bloomberg Commodity Index, diversified commodity exposure reduced overall portfolio drawdown by an average of 12–18% during equity market corrections between 2020 and 2025. That’s not a trivial buffer. The logic is simple: when consumer prices rise, the things that produce those prices — wheat, crude oil, copper — tend to rise in value too.
Breaking Down the Three Pillars
🌾 Agricultural Commodities (Soft & Hard)
Agricultural commodities — think wheat, corn, soybeans, coffee, and sugar — are driven by weather patterns, geopolitical trade policies, and increasingly, climate disruption. In 2026, the La Niña weather pattern affecting South American soybean yields has pushed soy futures up roughly 14% year-to-date. Meanwhile, wheat prices remain elevated due to continued supply uncertainty in Eastern Europe.
For retail investors, exposure to agriculture can come through ETFs like the Invesco DB Agriculture Fund (DBA) or direct commodity futures for more experienced traders. Agriculture tends to have a low correlation with equities, which is exactly what you want in a diversified strategy.
⚡ Energy Commodities
Energy remains the most volatile category, but also one of the most impactful. Crude oil (WTI and Brent), natural gas, and increasingly, renewable energy certificates are all part of the modern energy commodity landscape. In Q1 2026, Brent crude is hovering around $88–92/barrel, supported by OPEC+ supply discipline and robust Asian demand recovery.
What’s interesting in 2026 is the rise of “transition energy” commodities — carbon credits and liquefied natural gas (LNG) futures are gaining traction as investable assets. If you’re sustainability-conscious, this opens up options beyond traditional oil plays.
🔩 Industrial & Precious Metals
Metals are arguably the most forward-looking commodity category right now. Copper — often called “Dr. Copper” because its price reflects global economic health — is in structural deficit as electrification demand surges. Lithium and cobalt, essential for EV batteries, saw price corrections in late 2024 but have stabilized and are trending upward again in 2026 as EV adoption accelerates in Southeast Asia and India.
Gold and silver remain classic safe-haven plays. Gold crossed $2,800/oz in early 2026 and has held firm, reinforced by central bank buying (particularly from China, India, and emerging market central banks diversifying away from dollar reserves).
Real-World Portfolio Examples: Domestic & International Approaches
South Korea Example: Korean retail investors have increasingly turned to commodity ETFs listed on the KRX (Korea Exchange) and global ETFs available through platforms like Kiwoom and Mirae Asset. A popular approach in 2026 among Korean individual investors is a “K-commodity barbell” — roughly 40% in energy ETFs, 35% in precious metals (especially gold-linked products), and 25% in agriculture ETFs. This reflects local sensitivity to import price inflation given Korea’s heavy reliance on energy and food imports.
U.S. / Global Example: The Yale Endowment model, long admired for its alternative asset allocation, has historically kept 10–15% in real assets including commodities. In 2026, many institutional advisors are recommending individual investors mirror a simplified version: a 10–15% commodity sleeve within a broader portfolio, split across three sub-categories.
A Practical Allocation Framework to Consider
Conservative Investor (Low Risk Tolerance): 5–8% commodities — focus on gold ETFs and broad commodity index funds. Avoid direct futures exposure.
Moderate Investor: 10–15% commodities — blend of gold, copper ETFs (like COPX), and an agricultural fund (like DBA or WEAT). Use quarterly rebalancing.
Growth-Oriented Investor: 15–20% commodities — include specific metal plays (lithium miners, cobalt royalty companies), energy transition assets, and active commodity mutual funds.
Key vehicle options in 2026: Commodity ETFs (easiest entry), commodity mutual funds, commodity-linked REITs (timberland, farmland), futures contracts (advanced), and mining/energy company stocks as a proxy.
Watch your costs: Commodity ETFs that hold futures contracts (rather than physical assets) can suffer from “roll yield decay” — where the cost of rolling expiring contracts eats into returns. Check the expense ratio AND the roll methodology before buying.
The Risks You Genuinely Need to Think About
Let’s be honest here — commodities aren’t a magic hedge. Agricultural prices can collapse after a bumper harvest season. Energy prices can crash if demand falters (remember 2020 negative oil prices?). And metals like lithium went through a brutal correction in 2023–2024 before recovering. Commodities are cyclical, and they can be stomach-churning.
Currency risk is also real. Most commodities are priced in USD, so if you’re investing from outside the U.S., a strengthening dollar can amplify losses even when commodity prices are rising in absolute terms.
Realistic Alternatives If Full Commodity Exposure Feels Too Much
Not everyone wants to dive headfirst into commodity futures. That’s completely reasonable. Here are some softer ways to get similar diversification benefits:
Farmland REITs like Gladstone Land (LAND) or FarmTogether platforms give you agricultural exposure with income (land rental) and without the volatility of futures markets.
Mining royalty companies like Wheaton Precious Metals or Franco-Nevada give you leveraged exposure to metals prices without the operational risk of running a mine.
Diversified natural resource funds — many asset managers offer actively managed funds that blend energy, agriculture, and metals exposure with professional oversight.
I-Bonds and TIPS (for U.S. investors) — inflation-linked bonds don’t track commodities directly but serve a similar inflation-hedging function with much lower volatility.
The key takeaway is this: you don’t have to go all-in on raw commodities to benefit from their diversification properties. There’s a spectrum of options, and the right one depends on your risk tolerance, time horizon, and how closely you want to monitor your positions.
Editor’s Comment : What I find genuinely fascinating about commodity investing in 2026 is that it forces you to think about the physical world — what gets grown, dug up, or burned to power civilization. That grounding in reality can actually make you a more thoughtful investor overall. Start small, understand what you own, and treat commodities as a complement to your core portfolio rather than a replacement for it. And if the idea of directly holding wheat futures makes you nervous? That’s your gut telling you to start with a broad commodity ETF or a farmland REIT first. There’s no shame in the conservative on-ramp.
지난해 말 한 지인이 이런 말을 했어요. “원유 ETF 하나만 담았다가 반 토막 났다”고요. 그분이 틀린 게 아니에요. 원자재 시장은 주식보다 변동성이 훨씬 크고, 단일 섹터에 집중하면 그 충격이 고스란히 포트폴리오에 전달됩니다. 2026년 현재, 미-중 무역 긴장 재점화, 중동·동유럽 지정학 리스크, 그리고 기후 이상에 따른 작황 불안까지 겹치면서 원자재 시장은 그 어느 때보다 복잡한 국면을 맞이하고 있어요. 그렇다면 농산물·에너지·금속이라는 세 개의 큰 축을 어떻게 배분하고 활용해야 할까요? 함께 고민해 보겠습니다.
📊 본론 1 — 세 섹터, 숫자로 보는 2026년 현황
원자재 시장은 크게 에너지(Energy), 금속(Metals), 농산물(Agriculture) 세 섹터로 나뉩니다. 각 섹터의 특성을 수치로 짚어보는 것이 분산 전략의 출발점이라고 봅니다.
① 에너지
2026년 1분기 기준, WTI 원유는 배럴당 약 78~85달러 구간에서 등락을 반복하고 있어요. OPEC+의 감산 기조는 유지되고 있지만, 미국 셰일 증산과 전기차 전환 가속이 수요 상단을 제한하는 구조입니다. 변동성 지수(CVOL 기준)는 원유가 약 32~38%로, 주식(S&P 500 VIX 약 18~22%)보다 현저히 높아요. 에너지는 고수익 가능성과 함께 하방 리스크도 크다는 점을 반드시 감안해야 합니다.
② 금속
금(Gold)은 2026년 들어 온스당 2,700달러 내외를 유지하며 안전자산 역할을 공고히 하고 있어요. 반면 구리(Copper)는 AI 데이터센터 확장, 전력망 인프라 투자 수요로 톤당 9,800~10,200달러 수준을 형성 중입니다. 리튬, 코발트 등 배터리 금속은 공급 과잉 우려로 2024~2025년 대비 가격이 20~35% 조정된 상태예요. 금속 섹터는 귀금속(안전자산형)과 산업금속(경기민감형)을 구분해서 바라봐야 합니다.
③ 농산물
2026년 초 엘니뇨 이후 라니냐 전환 영향으로 밀·옥수수·대두 가격이 불안정한 흐름을 보이고 있어요. 시카고 상품거래소(CBOT) 기준 옥수수는 부셸당 약 4.5~5.2달러, 대두는 9.8~11.0달러 수준입니다. 농산물은 계절성과 기후 변수가 강하지만, 에너지·금속과의 상관관계가 낮다(상관계수 약 0.2~0.35)는 점에서 포트폴리오 분산 효과가 탁월합니다.
🌍 본론 2 — 국내외 실제 분산투자 사례
해외 사례 — 예일 기금(Yale Endowment)과 원자재 편입
예일대 기금은 2000년대 초부터 원자재를 포트폴리오에 편입한 선구자로 꼽혀요. 당시 데이비드 스웬슨이 이끌던 운용팀은 원자재의 인플레이션 헤지(hedge) 기능에 주목했습니다. 특히 에너지와 금속을 전체 자산의 7~10% 수준으로 유지하면서, 전통 주식·채권과의 낮은 상관관계를 활용해 위험 조정 수익률(Sharpe Ratio)을 개선한 것으로 알려져 있어요.
국내 사례 — 연기금과 원자재 실물 ETF
국내에서는 국민연금이 2023년 이후 원자재 ETF 비중을 조금씩 늘리는 방향으로 포트폴리오를 조정했다는 보도가 있었어요. 개인 투자자 관점에서도 KODEX 골드선물, TIGER 원유선물Enhanced, KODEX 농산물선물 등 국내 상장 원자재 ETF를 활용하면 비교적 소액으로도 세 섹터에 걸친 분산이 가능해졌습니다. 다만 국내 원자재 ETF는 선물 기반인 경우가 많아 롤오버 비용(Roll Cost) 문제를 반드시 확인해야 한다고 봅니다.
⚖️ 실전 분산 배분 — 어떤 비율이 현실적일까?
정답은 없지만, 다음과 같은 접근법이 일반적으로 검토되는 것 같아요.
안정형 (리스크 최소화 우선) — 금 등 귀금속 50% + 에너지 30% + 농산물 20%. 인플레이션 방어에 집중하되 변동성을 낮게 가져가는 구조예요.
균형형 (인플레 헤지 + 성장) — 에너지 35% + 금속(귀금속+산업금속 혼합) 40% + 농산물 25%. 가장 고전적인 원자재 포트폴리오 구성에 가깝습니다.
공격형 (고수익 추구) — 에너지 45% + 산업금속(구리·니켈 중심) 35% + 농산물 20%. 경기 회복 국면에서 수익을 극대화하는 전략이지만 변동성도 그만큼 커요.
리밸런싱 주기 — 원자재는 계절성과 이벤트 리스크가 크기 때문에 분기 1회 이상 비중을 점검하는 것이 바람직하다고 봅니다.
통화 리스크 주의 — 원자재는 대부분 달러 표시 자산이라, 원/달러 환율 방향도 실질 수익에 큰 영향을 미쳐요. 환헤지 여부를 상품 선택 시 꼭 확인하세요.
직접 투자 vs. ETF/ETN — 개인 투자자라면 실물 보유보다 ETF나 ETN이 현실적이에요. 단, ETN은 발행사 신용 리스크가 존재한다는 점도 염두에 두어야 합니다.
🔍 결론 — 분산은 수익을 극대화하는 게 아니라, 손실을 버틸 수 있게 해준다
원자재 분산투자의 핵심은 “어떤 섹터가 오를까”를 맞히는 게 아니에요. 어떤 국면에서도 포트폴리오 전체가 버틸 수 있는 구조를 만드는 것이라고 봅니다. 에너지가 지정학적 이벤트로 급등할 때 농산물은 조용할 수 있고, 경기 침체기에 금이 빛을 발할 때 산업금속은 약세일 수 있어요. 이 서로 다른 리듬이 섞일 때 비로소 분산의 의미가 살아납니다.
2026년 현재처럼 불확실성이 높은 시장에서는, 단일 원자재에 집중하기보다 세 섹터를 아우르는 바스켓 접근법이 더 유효하다고 생각해요. 완벽한 비율은 없지만, 자신의 투자 목적(인플레 헤지인지, 수익 추구인지)을 먼저 명확히 하는 것이 출발점이 되어야 합니다.
에디터 코멘트 : 원자재 투자를 처음 시작하신다면, 세 섹터를 한꺼번에 담는 글로벌 원자재 ETF(예: iShares S&P GSCI Commodity-Indexed Trust 계열)로 시작해 보시는 것도 괜찮은 방법인 것 같아요. 섹터별 개별 ETF로 직접 배분하는 건 어느 정도 시장 흐름이 눈에 들어오기 시작할 때 해도 늦지 않습니다. 서두르지 않는 것 자체가 이미 전략이니까요.
A friend of mine — let’s call him James — poured $15,000 into a small lithium mining ETF back when everyone was buzzing about the EV revolution. For a while, it looked brilliant. Then supply chain disruptions, shifting battery chemistry trends, and volatile commodity prices turned his ‘sure thing’ into a white-knuckle ride. By early 2026, he’s finally back in the black — but only because he diversified his approach rather than doubling down blindly. His story is more common than you’d think, and it’s exactly why we need to talk about rare metal investing with clear eyes and a solid strategy.
Lithium and cobalt sit at the absolute heart of the global energy transition. From the battery pack in your EV to grid-scale storage systems powering entire neighborhoods, these two metals are foundational. But investing in them? That’s a nuanced game that rewards patience, research, and strategic diversification — not just hype-chasing.
📊 Where Do Lithium & Cobalt Stand in 2026?
Let’s ground ourselves in the current landscape. As of early 2026, the rare metal markets are navigating a fascinating — and somewhat volatile — transition period:
Lithium prices have partially recovered after a significant correction in 2024–2025, currently hovering around $14,000–$17,000 per metric ton for lithium carbonate. The oversupply shock from aggressive Australian and Chilean production expansions is beginning to ease as demand from next-gen battery manufacturers catches up.
Cobalt remains structurally complex. The Democratic Republic of Congo (DRC) still supplies roughly 70% of global cobalt, keeping geopolitical risk perpetually on the table. Spot prices in 2026 sit near $28,000–$33,000 per metric ton, with moderate recovery driven by aerospace and solid-state battery applications.
The global EV fleet surpassed 450 million units on the road in 2026, with battery demand projections indicating sustained growth through at least 2035 — a fundamental tailwind for both metals.
However, battery chemistry evolution (particularly the rise of LFP — lithium iron phosphate — batteries that use zero cobalt) continues to suppress cobalt demand growth forecasts from legacy projections.
🔍 The Real Risk Factors Most Investors Ignore
Here’s where a lot of retail investors trip up — they see ‘EV demand rising = buy lithium/cobalt’ and stop the analysis there. But let’s think a few steps further:
Technology substitution risk: Sodium-ion batteries, solid-state batteries with reduced cobalt content, and lithium-sulfur chemistries are all advancing rapidly. A major technology breakthrough could restructure demand overnight.
Supply concentration risk: Lithium production is dominated by the ‘Lithium Triangle’ (Chile, Argentina, Bolivia) and Australia. Cobalt is overwhelmingly DRC-centric. Political instability or regulatory shifts in any of these regions can create violent price swings.
Recycling as a market disruptor: By 2026, battery recycling operations in South Korea, Germany, and the U.S. are scaling rapidly. Recovered lithium and cobalt from recycled EV batteries are beginning to meaningfully supplement virgin supply — this is deflationary pressure many investors haven’t priced in.
Currency and hedging complexity: Commodities trade in USD. For non-US investors, currency fluctuation adds another layer of risk that requires active hedging consideration.
🌍 Real-World Investment Examples: What’s Working in 2026
Let’s look at how different types of investors are actually approaching this space right now — both domestically and internationally.
South Korea — POSCO Holdings’ Integrated Lithium Play: POSCO has aggressively vertically integrated its lithium supply chain, investing in Argentine lithium brine operations and domestic processing facilities. Korean retail investors who bought POSCO Holdings shares during the 2024 dip and held through 2025’s restructuring are seeing meaningful returns in 2026 as their lithium chemicals segment ramps production. This is a classic ‘pick-and-shovel’ approach — investing in the industrial processor rather than the raw miner.
United States — Albemarle Corporation (ALB): Albemarle, one of the world’s largest lithium producers, used the 2024–2025 price correction period to cut costs and streamline operations. By Q1 2026, with lithium prices recovering and their Chilean and Australian assets operating more efficiently, ALB has become a benchmark holding for U.S. institutional investors wanting direct lithium exposure with some operational hedging.
Global ETF Approach — REMX (VanEck Rare Earth/Strategic Metals ETF): For investors who want diversified rare metal exposure without picking individual miners, REMX remains a popular vehicle in 2026. It blends lithium, cobalt, rare earth, and critical mineral companies across multiple geographies, effectively smoothing out single-asset volatility. It’s not the sexiest choice, but it’s the one that lets you sleep at night.
Australia — Direct Mining Shares (Pilbara Minerals, IGO Limited): Australian investors have had a front-row seat to the lithium rollercoaster. Pilbara Minerals, after a brutal correction, has stabilized with improved operational efficiency and long-term offtake agreements with Asian battery manufacturers. IGO Limited’s cobalt/nickel exposure adds an interesting blended critical minerals thesis.
💡 Strategic Frameworks: How Should You Actually Approach This?
Rather than giving you a blanket ‘buy this ticker’ recommendation (which would be irresponsible given individual financial situations), let’s think through strategic frameworks based on your investor profile:
Conservative investors: Consider diversified critical minerals ETFs (like REMX or LITH) as a 3–7% portfolio allocation. You get thematic exposure without catastrophic single-asset risk.
Moderate risk tolerance: Layer ETF exposure with 1–2 positions in vertically integrated companies (think POSCO, Albemarle, or Glencore for cobalt) rather than pure-play explorers. Integrated companies have revenue from multiple segments that cushion commodity price swings.
Higher risk / speculative: If you want the explosive upside of junior miners or explorers, keep these positions small (under 5% of portfolio each) and accept that many will fail. The ones that succeed can be transformative — but the failure rate is brutal.
The ‘infrastructure’ play: Consider companies building battery recycling facilities, lithium refining capacity, or battery gigafactories. These benefit from the same secular trend with potentially less commodity price volatility than raw miners.
Timing and averaging: Given the cyclical nature of commodity markets, dollar-cost averaging into positions over 6–12 months dramatically reduces the risk of buying at a cyclical peak.
🔄 Realistic Alternatives if Direct Metal Investment Feels Too Risky
Not everyone should be directly buying mining stocks or commodity ETFs — and that’s completely fine. Here are adjacent strategies that still let you participate in the rare metal megatrend:
EV manufacturer exposure: Companies like BYD, Tesla, or Hyundai benefit enormously from the same EV growth trend, with far more diversified business models than a single miner.
Battery technology companies: Firms advancing solid-state, sodium-ion, or next-generation battery tech are critical minerals-agnostic in the long run — they solve the problem regardless of which metal wins.
Grid storage infrastructure: Utility-scale energy storage companies benefit from lithium demand without you needing to predict lithium prices specifically.
Green energy REITs and infrastructure funds: These provide indirect exposure to the energy transition at a much more stable risk profile.
The through-line in all of these? You’re investing in the direction of travel — electrification, decarbonization, energy independence — without betting the farm on a single volatile commodity. That’s how James eventually stabilized his portfolio, and it’s worth considering for yours too.
Rare metal investing in 2026 rewards those who understand both the macro tailwinds and the micro risks. The opportunity is genuinely compelling — but so is the complexity. Go in with a clear thesis, a diversified approach, and realistic expectations, and this space can be a meaningful part of a forward-looking portfolio.
Editor’s Comment : The lithium and cobalt story is far from over — if anything, 2026 represents a more mature entry point than the hype-peak of earlier years. The correction has washed out the weakest players, valuations are more reasonable, and the fundamental demand drivers (EVs, grid storage, consumer electronics) remain structurally intact. Just remember: the smartest money in this space isn’t going all-in on a single bet. It’s building a mosaic of exposure — miners, processors, recyclers, and technology enablers — that captures the upside of the rare metal revolution without being destroyed by its inevitable volatility. Diversify thoughtfully, stay informed on battery chemistry trends, and treat this as a 5–10 year thesis, not a quarterly trade.
얼마 전 한 지인이 이런 말을 했어요. “전기차 붐 때 리튬 ETF 샀다가 반토막 났는데, 지금 다시 들어가야 하는 거 아닌가요?” 그 물음이 꽤 오래 머릿속에 맴돌았습니다. 리튬과 코발트, 이 두 금속은 단순한 원자재가 아니라 에너지 전환 시대의 핵심 인프라 소재인데도 불구하고 가격 변동성이 워낙 크다 보니 투자자들 사이에서 ‘기회인지 덫인지’ 판단이 엇갈리는 경우가 많아요. 2026년 현재 시점에서 이 두 희귀금속의 시장 흐름을 함께 짚어보고, 어떤 접근이 현실적인지 고민해 보겠습니다.
📊 수치로 보는 리튬·코발트 시장: 2026년 현재 어디쯤 왔나?
리튬 가격은 2022년 말 탄산리튬(Li₂CO₃) 기준 톤당 약 80,000달러까지 치솟았다가 2023~2024년에 걸쳐 급격히 하락, 2025년에는 톤당 10,000~13,000달러 수준까지 내려앉았습니다. 2026년 1분기 현재는 일부 회복세를 보이며 약 14,000~16,000달러 구간에서 등락을 반복하고 있는 것으로 보입니다.
코발트의 경우는 조금 다른 흐름을 보여요. 런던금속거래소(LME) 기준 코발트 가격은 2026년 초 기준 톤당 약 25,000~28,000달러 수준으로, 2022년 고점(약 82,000달러) 대비 여전히 크게 낮은 수준입니다. 콩고민주공화국(DRC)이 전 세계 코발트 공급의 약 70% 이상을 담당하고 있다는 구조적 공급 집중 문제는 여전히 해소되지 않았어요.
주목할 만한 수치가 하나 더 있습니다. 국제에너지기구(IEA)의 2026년 보고서에 따르면, 2030년까지 전기차 배터리 수요를 충족하기 위해 필요한 리튬 수요는 현재 생산량 대비 약 3~4배 증가할 것으로 추산되고 있어요. 공급이 수요를 따라가지 못하는 구조적 공급 부족(structural supply deficit)이 중장기적으로는 가격을 끌어올릴 가능성이 높다고 봅니다.
🌍 국내외 사례로 보는 희귀금속 투자의 명암
해외 사례 — 칠레 SQM과 호주 Pilbara Minerals
세계 최대 리튬 생산 기업 중 하나인 칠레의 SQM(Sociedad Química y Minera)은 2022~2023년 리튬 가격 폭락 이후 주가가 고점 대비 60% 이상 하락하는 충격을 받았지만, 2025년 하반기부터 칠레 정부의 리튬 국영화 정책 완화와 신규 채굴 라이선스 확대에 힘입어 점진적인 회복세를 보이고 있어요. 반면 호주의 Pilbara Minerals는 공격적인 생산 확대 전략을 유지하면서도 배터리 제조사들과의 장기 공급 계약(offtake agreement)으로 가격 리스크를 일부 헤지하는 모습을 보여줬습니다.
국내 사례 — 포스코홀딩스와 POSCO Future M
국내에서는 포스코그룹이 아르헨티나 리튬 광산 지분 투자와 함께 국내 수산화리튬 생산 공장(광양)을 가동하며 수직 계열화(vertical integration) 전략을 실행 중입니다. 2026년 현재 POSCO Future M은 양극재 생산 능력을 연간 약 17만 톤 이상으로 확대한 것으로 알려져 있어요. 이는 단순히 원자재를 사고파는 투자보다, 밸류체인 전반에 걸친 접근이 훨씬 안정적일 수 있다는 힌트를 줍니다.
⚠️ 리튬·코발트 투자 시 반드시 알아야 할 리스크 요인
리튬인산철(LFP) 배터리의 부상: 중국 CATL과 BYD가 주도하는 LFP 배터리는 코발트를 거의 사용하지 않아요. 코발트 수요의 구조적 감소 요인이 될 수 있습니다.
나트륨이온 배터리(Na-ion) 기술 발전: 리튬을 사용하지 않는 차세대 배터리 기술이 2026년 현재 상업화 초기 단계에 진입했어요. 중장기적으로는 리튬 수요 증가세를 일부 상쇄할 수 있는 변수입니다.
지정학적 리스크: DRC의 정치 불안정, 칠레·아르헨티나의 자원 국유화 정책 변화, 미-중 공급망 갈등은 단기 가격 변동성을 극도로 키울 수 있는 요인이라고 봅니다.
배터리 리사이클링 시장 성장: 유럽연합(EU)의 배터리 규정(EU Battery Regulation 2023)이 본격 시행되면서 재활용 리튬·코발트 공급이 늘고 있어요. 원광 의존도가 낮아질수록 신규 채굴 수요 상승분이 제한될 수 있습니다.
환율 및 금리 변수: 희귀금속은 달러 표시 자산이라 원/달러 환율 움직임에도 수익률이 직접적인 영향을 받습니다.
💡 2026년 현실적인 투자 접근 전략
단순히 “리튬이 오를 것 같아서” 관련 ETF를 매수하는 방식은 상당한 타이밍 리스크를 수반한다고 봐요. 대신 다음과 같은 접근을 고민해 볼 만합니다.
첫째, 분산 투자형 ETF 활용입니다. 리튬 단일 ETF보다는 배터리 소재 전반(리튬, 코발트, 니켈, 망간)을 포함하는 글로벌 배터리 소재 ETF나, 에너지 전환 테마형 ETF를 통해 특정 금속의 가격 급락 리스크를 분산하는 방법이 있어요. 국내에서는 TIGER 글로벌리튬&2차전지SOLACTIVE, 해외에서는 Global X Lithium & Battery Tech ETF(LIT) 등이 대표적입니다.
둘째, 밸류체인 기업 직접 투자예요. 광산 기업 대신 양극재·음극재·전해질 등 배터리 소재 기업이나, 리사이클링 기업에 투자하면 원자재 가격 변동성을 어느 정도 완충할 수 있습니다. 에코프로비엠, 엘앤에프, 솔루스첨단소재 같은 국내 기업들이 그 예가 될 수 있어요.
셋째, 적립식 분할 매수입니다. 지금 가격이 바닥인지 아닌지 아무도 정확히 알 수 없어요. 목돈을 한 번에 투자하기보다 3~6개월에 걸쳐 나눠 진입하는 방식이 심리적 부담도 낮추고 평균 단가도 안정시켜 줍니다.
에디터 코멘트 : 리튬과 코발트는 분명 미래 에너지 전환의 핵심 소재이지만, ‘좋은 스토리’와 ‘좋은 투자’는 언제나 같지 않다는 걸 이 시장이 지난 몇 년간 똑똑히 보여줬어요. 기술 대체 리스크, 지정학 변수, 리사이클링 공급 증가라는 세 가지 구조 변화를 항상 염두에 두면서, 단기 트레이딩보다는 3~5년 시계(時界)로 접근하는 게 현실적이라고 봅니다. 특히 코발트는 LFP·Na-ion 배터리 확산으로 인해 리튬보다 구조적 역풍이 더 강하다는 점, 꼭 기억해 두세요.
A few months ago, a close friend of mine — let’s call her Sarah — called me in a panic. She’d just opened a futures trading account after watching a 20-minute YouTube video about crude oil prices. Within two weeks, she’d lost 40% of her initial deposit. “I thought it was just like buying stocks,” she told me, her voice genuinely shaken. Sound familiar? If you’ve been eyeing commodity futures — gold, oil, wheat, copper — as your next investment frontier, this guide is for you. Let’s slow down, think this through together, and figure out if it’s actually the right move for your situation.
What Exactly Are Commodity Futures? (And Why They’re Not Like Stocks)
Let’s start with the basics. A commodity future is a legally binding contract to buy or sell a specific quantity of a raw material — like crude oil, natural gas, gold, silver, corn, or soybeans — at a predetermined price on a set future date. Unlike stocks, where you’re buying a piece of a company, you’re here essentially making a time-sensitive bet on the direction of a physical good’s price.
The key distinction that trips up beginners? Leverage. In futures trading, you don’t pay the full contract value upfront. You put down a margin deposit — typically 3% to 12% of the total contract value. This means a relatively small price movement can produce enormous gains or devastating losses relative to your initial investment. In 2026, the CME Group (Chicago Mercantile Exchange), the world’s largest futures exchange, reports that retail participation in commodity futures has grown by roughly 18% compared to 2023 levels — but so have margin calls among inexperienced traders.
The 2026 Commodity Landscape: What’s Actually Moving the Markets
Understanding the current macro environment is non-negotiable before you place a single trade. Here’s what’s shaping commodity futures markets right now:
Energy (Crude Oil & Natural Gas): Brent crude has been oscillating in the $78–$95/barrel range through early 2026, driven by OPEC+ supply decisions and ongoing demand shifts as EV adoption accelerates globally. Natural gas remains highly volatile due to fluctuating LNG export demand from Europe.
Precious Metals (Gold & Silver): Gold crossed $3,100/oz in Q1 2026, sustained by persistent global inflation concerns and central bank accumulation — particularly from emerging market central banks. This makes gold futures one of the more “predictable” plays in theory, but the leverage still bites.
Agricultural Commodities (Wheat, Corn, Soybeans): La Niña weather patterns and geopolitical disruptions in key growing regions have made agricultural futures exceptionally volatile in 2026. The FAO Food Price Index remains elevated, which sounds like an opportunity — but weather-driven price swings can reverse overnight.
Industrial Metals (Copper, Lithium): Copper demand tied to the green energy transition keeps long-term bulls excited, while lithium has experienced dramatic price corrections after the 2023–2024 speculative frenzy. Copper futures on the LME (London Metal Exchange) are widely watched as a leading economic indicator.
Real-World Examples: Wins, Losses, and Hard Lessons
Let’s look at some real scenarios that illustrate how commodity futures play out in practice.
The Korean Retail Investor Surge (Domestic Example): Between 2024 and 2026, Korean retail investors dramatically increased their participation in overseas commodity futures, largely through platforms offered by domestic securities firms like Mirae Asset and Samsung Securities. A Korea Financial Supervisory Service report from late 2025 highlighted that while a subset of informed traders — particularly those hedging existing business exposure to raw materials — found genuine value, the majority of purely speculative retail accounts underperformed, with over 62% showing net losses within their first year. The lesson? Access has never been easier; education clearly hasn’t kept pace.
The Gold Trade That Worked — For a Reason (International Example): A commodity trading advisor (CTA) fund based in Zurich made headlines in mid-2025 for riding gold’s rally from $2,700 to $3,100 using a systematic trend-following strategy. What’s instructive here isn’t the profit itself — it’s how they did it: strict position sizing (never more than 2% of capital at risk per trade), defined stop-loss levels, and zero emotional decision-making. This is the institutional discipline that retail beginners rarely replicate.
The Wheat Futures Trap (Agricultural Cautionary Tale): In early 2026, a popular Reddit investing community collectively got excited about wheat futures following news of crop failures in the Black Sea region. Many retail traders piled into long positions — only to see prices reverse sharply when alternative supply channels emerged faster than expected. Dozens of posts followed about margin calls and unexpected contract rollover costs. This brings us to a concept beginners almost always miss: contango and backwardation.
Terms Every Beginner Must Understand
Before you even open a demo account, internalize these concepts:
Margin & Margin Call: Your initial deposit that “holds” the contract. If the market moves against you and your account falls below the maintenance margin, your broker demands more funds immediately — or liquidates your position.
Contango: When futures prices are higher than the current spot price. This is the norm for many commodities. If you hold a futures contract and “roll it over” (extend to the next month), you’re continuously buying at a higher price than you sell. This quietly erodes returns for long-term holders — a hidden cost that catches beginners off guard.
Backwardation: The opposite of contango — futures prices are below the spot price. This environment actually benefits long futures holders during rollovers.
Contract Expiry: Every futures contract has an expiration date. Unlike stocks, you can’t just “hold forever.” You must either roll the contract or take physical delivery (yes, theoretically, you could end up obligated to receive 1,000 barrels of oil — though brokers typically close retail positions before this happens).
Liquidity Risk: Some commodity futures contracts trade with thin volume. Wide bid-ask spreads mean you lose money entering and exiting, before the market even moves against you.
How to Actually Start — A Step-by-Step Approach for 2026
If after all of this you’re still genuinely interested — great! Here’s a realistic path forward:
Step 1 — Paper Trade First: Most brokers (TD Ameritrade’s thinkorswim, Interactive Brokers, and others) offer simulated trading environments. Spend at least 60–90 days here. No exceptions.
Step 2 — Start With Highly Liquid Markets: Gold (GC on CME) and WTI Crude Oil (CL on CME) are your safest starting points in terms of liquidity and information availability. Avoid exotic agricultural contracts until you’re confident.
Step 3 — Use Micro Futures: The CME’s Micro Gold (MGC) and Micro WTI Crude Oil (MCL) contracts are 1/10th the size of standard contracts. This significantly reduces your risk exposure while you learn. A single Micro Gold contract in March 2026 controls roughly 10 troy ounces — manageable for a beginner.
Step 4 — Define Your Risk Per Trade: Professional traders rarely risk more than 1–2% of their total capital on any single trade. If you have $10,000 to start, your maximum loss per trade should be $100–$200. Calculate your position size accordingly.
Step 5 — Have an Exit Strategy Before You Enter: Know exactly at what price you’ll admit you’re wrong and exit. Set stop-loss orders. Letting losses “run” while hoping for a reversal is the single most common way beginners blow up accounts.
Realistic Alternatives Worth Considering
Here’s the honest part of this conversation: direct commodity futures trading is genuinely not suitable for everyone, and there’s absolutely no shame in that. The leverage, the complexity, and the time commitment required to do it well are significant. But that doesn’t mean you have to miss out on commodity exposure entirely. Consider these alternatives based on your situation:
Commodity ETFs & ETNs: Products like SPDR Gold Shares (GLD), iShares Copper & Metals Mining ETF (ICOP), or diversified commodity ETFs like iShares GSCI Commodity Dynamic Roll Strategy ETF (COMT) give you price exposure without managing futures contracts yourself. They handle the rolling costs and logistics. The tradeoff? You won’t get the same amplified returns — but you also won’t get the amplified losses.
Mining & Energy Stocks: Investing in companies like Barrick Gold, Rio Tinto, or ExxonMobil gives you indirect commodity exposure with the added benefit of company fundamentals. These are far more familiar territory for most investors.
Commodity-Focused Mutual Funds or REITs: For truly passive investors, some mutual funds and ETFs specifically target commodity-linked returns with professional management built in.
Structured Products with Defined Risk: Some financial institutions now offer structured notes tied to commodity indices with built-in capital protection (up to a certain level). Worth exploring if you want upside participation with a ceiling on downside.
The bottom line? Commodity futures investing in 2026 is more accessible than ever — but accessible doesn’t mean easy. The infrastructure is there. The education is out there. What separates the Sarah story from the Zurich CTA story is almost entirely preparation, discipline, and an honest self-assessment of risk tolerance. Take the time to build that foundation, and commodity futures can be a genuinely powerful tool in a diversified portfolio. Rush in without it, and you’re essentially playing a casino game with extra steps.
Editor’s Comment : The commodity markets in 2026 are genuinely fascinating — gold at historic highs, energy in flux, and agricultural markets reshaping geopolitical conversations. But every week, I hear stories like Sarah’s. The opportunity is real. The risk is equally real. If there’s one thing I’d want you to take from this piece, it’s this: start with micro contracts and simulated accounts, not with real capital and FOMO. The markets will still be there once you’re ready. Your capital, if lost prematurely, won’t be.
직장 동료 한 명이 얼마 전 이런 말을 했어요. “요즘 주식은 너무 출렁거리고, 예금 금리는 다시 내려가는 것 같아서 원자재 선물을 알아보고 있는데… 솔직히 뭐부터 시작해야 할지 모르겠어.” 아마 이 글을 클릭하신 분들도 비슷한 고민을 하고 계실 것 같습니다. 2026년 현재, 글로벌 공급망 재편과 기후 변화 이슈가 맞물리면서 원자재 시장은 그 어느 때보다 주목받고 있어요. 하지만 ‘선물(Futures)’이라는 단어 자체가 주는 복잡함 때문에 많은 분들이 문턱에서 멈추고 맙니다. 오늘은 그 문턱을 함께 넘어보려 합니다.
1. 원자재 선물, 도대체 어떤 구조인가요?
선물(Futures) 계약이란, 특정 원자재를 미래의 특정 시점에 오늘 정한 가격으로 사고팔겠다는 약속이라고 보면 됩니다. 예를 들어 서부텍사스산 원유(WTI) 1계약은 1,000배럴 단위로 거래되는데, 2026년 3월 현재 WTI 현물 가격이 배럴당 약 72~78달러 사이를 오가고 있다는 점을 감안하면, 계약 하나의 명목 가치는 무려 7만 달러(약 9,500만 원)에 달합니다.
그런데 실제로 이 돈을 다 내야 하느냐? 그렇지 않아요. 선물 거래는 ‘증거금(Margin)’ 방식으로 작동합니다. 전체 계약 금액의 약 5~10%만 예치하면 거래가 가능하죠. 이게 바로 선물 투자의 양날의 검인 레버리지(Leverage)입니다.
레버리지의 기회: 증거금 500만 원으로 1억 원 규모의 원자재 포지션을 취할 수 있습니다. 가격이 5% 오르면 500만 원의 수익, 즉 원금 대비 100% 수익률이 나오죠.
레버리지의 위험: 반대로 가격이 5% 하락하면 증거금 500만 원이 전부 날아가는 구조입니다. 낙폭이 더 크면 ‘마진콜(Margin Call)’이 발생해 추가 증거금을 납입해야 하거나 포지션이 강제 청산됩니다.
롤오버(Rollover) 비용: 선물은 만기가 있어요. 매월 혹은 분기마다 계약을 갱신해야 하는데, 이 과정에서 ‘콘탱고(Contango)’ 상태(근월물보다 원월물 가격이 비싼 상태)일 경우 지속적인 비용이 발생합니다. 원유 ETF가 현물 가격을 제대로 추종하지 못하는 이유가 바로 여기에 있습니다.
주요 거래소: CME(시카고 상업거래소)가 원유·곡물·금속의 글로벌 허브이며, 국내에서는 한국거래소(KRX)에서 금 선물, 돼지고기 선물 등을 거래할 수 있습니다.
2. 원자재별 특성: 금, 원유, 곡물은 어떻게 다른가요?
원자재를 하나의 덩어리로 보면 안 됩니다. 각각 움직이는 논리가 완전히 다르거든요.
① 금(Gold): 대표적인 ‘안전자산’으로, 달러 약세·인플레이션·지정학적 불안 시 강세를 보입니다. 2026년 들어 미 연준(Fed)의 금리 인하 사이클이 본격화되면서 금 선물 가격은 온스당 2,800달러 전후를 탐색하는 중이라고 봅니다. 초보자가 가장 접근하기 쉬운 원자재 중 하나예요.
② 원유(Crude Oil): OPEC+ 감산 정책, 미국 셰일오일 생산량, 중국 수요 등 변수가 너무 많아 전문가들도 예측이 어렵다고 인정하는 시장입니다. 변동성이 크다는 것은 그만큼 기회와 위험이 공존한다는 의미라고 볼 수 있어요.
③ 곡물(밀, 옥수수, 대두): 기후 변화, 재배 면적, 라니냐·엘니뇨 사이클에 민감하게 반응합니다. 2026년에는 남미 아르헨티나와 브라질의 대두 작황 여부가 시장의 핵심 변수로 떠오르고 있는 상황입니다. 계절성이 뚜렷해 ‘농업 사이클’을 공부하면 나름의 패턴을 읽을 수 있다는 장점이 있어요.
3. 국내외 사례로 보는 원자재 선물 투자의 교훈
2020년 4월, 역사적으로 전무후무한 사건이 있었습니다. WTI 원유 선물 5월물 가격이 배럴당 -37.63달러로 마이너스를 기록한 일이죠. 코로나19로 인한 수요 붕괴와 저장 공간 부족이 동시에 발생한 탓이었습니다. 당시 국내에서도 원유 선물 ETP(상장지수증권) 상품에 뒤늦게 올라탄 개인 투자자들이 큰 피해를 입었어요. 이 사례가 던지는 교훈은 명확합니다. 선물 시장은 단순히 ‘가격이 오를 것 같다’는 직관만으로 접근하기엔 구조 자체가 너무 복잡하다는 점입니다.
반면 긍정적인 사례도 있습니다. 2022~2023년 러시아-우크라이나 전쟁 장기화로 밀 선물 가격이 급등했을 때, 이 흐름을 미리 포착한 일부 개인 투자자들은 밀 선물 ETF나 농업 관련 펀드를 통해 상당한 수익을 올렸습니다. 중요한 건 ‘직접 선물 계약’이 아니라 ETF·ETN을 통한 간접 투자로 리스크를 조절했다는 점이에요.
4. 초보자를 위한 현실적인 진입 전략
직접 선물 계약을 거래하기 전에, 다음과 같은 단계적 접근법을 고려해 보시는 게 좋을 것 같아요.
1단계 – ETF로 시장 감각 익히기: KODEX 금선물(H), TIGER 원유선물Enhanced(H) 같은 국내 상장 원자재 ETF로 시작하세요. 소액으로도 매수 가능하고, 선물 롤오버 리스크를 운용사가 관리해 줍니다.
2단계 – 모의 거래 플랫폼 활용: CME 공식 사이트에서는 무료 모의 거래(Paper Trading) 기능을 제공합니다. 실제 돈을 넣기 전에 최소 3개월은 모의 거래로 구조를 체감해 보길 권합니다.
3단계 – 포지션 사이징 철칙: 원자재 선물에 투자하는 자금은 전체 투자 포트폴리오의 10~15% 이내로 제한하는 것이 합리적이라고 봅니다. 헤지(Hedge) 수단으로 활용하는 관점이 좋아요.
4단계 – 매크로 공부를 병행하기: 달러 인덱스(DXY), 미국 CPI(소비자물가지수), 중국 PMI(제조업 구매관리자지수)는 원자재 시장과 직결되는 지표입니다. 이 세 가지만 꾸준히 모니터링해도 시장의 큰 흐름을 읽는 데 도움이 됩니다.
5단계 – 손절 원칙을 사전에 설정하기: 레버리지 상품인 만큼, 진입 전에 반드시 손절 기준(예: -8% 또는 증거금의 20% 손실 시 청산)을 정하고 이를 기계적으로 지켜야 합니다.
결론: 원자재 선물은 ‘알고 나서’ 시작해도 늦지 않아요
원자재 선물 시장은 분명 매력적인 투자처입니다. 주식·채권과 상관관계가 낮아 포트폴리오 분산 효과가 있고, 인플레이션 헤지 수단으로도 기능하거든요. 하지만 레버리지, 롤오버 비용, 만기 구조 등 주식과는 다른 고유한 메커니즘을 제대로 이해하지 못한 채 뛰어드는 것은 상당히 위험하다고 봅니다.
2026년 현재, 국내 투자자들이 접근할 수 있는 원자재 관련 금융 상품은 그 어느 때보다 다양해졌어요. 직접 선물 계약이 부담스럽다면, ETF나 원자재 기업 주식(예: 광산 기업, 에너지 기업)부터 차근차근 경험을 쌓아가는 것이 가장 현실적인 대안이라고 생각합니다.
에디터 코멘트 : 원자재 선물 투자에서 가장 많이 보이는 실수는 ‘가격이 쌀 때 사는 것’이 아니라 ‘구조를 모른 채 사는 것’입니다. 오늘 이 글을 읽으셨다면 이미 대부분의 초보 투자자보다 한 발 앞서 계신 거예요. 조급해하지 말고, ETF로 먼저 시장의 리듬을 몸으로 익혀보세요. 시장은 항상 기회를 다시 줍니다.
태그: [‘원자재 선물 투자’, ‘선물 투자 초보자’, ‘금 원유 곡물 투자’, ‘원자재 ETF’, ‘레버리지 투자 위험’, ‘포트폴리오 분산 투자’, ‘2026 원자재 시장’]
Picture this: it’s early 2026, and a finance minister in a mid-sized emerging economy wakes up to find that overnight currency swap lines have dried up, the central bank’s foreign reserves have dropped below three months of import cover, and the local currency has shed 18% of its value in a single trading session. Sound dramatic? It happened to Sri Lanka in 2022, Turkey in 2021, and Argentina — well, Argentina has made something of a habit of it. The point is, currency crises in emerging markets don’t appear out of nowhere. They brew quietly, signal loudly (to those paying attention), and then erupt in ways that ripple far beyond the country in question.
So let’s sit down together and work through what the data is telling us in 2026, which economies are flashing amber or red, and — crucially — what you as an investor, traveler, or policy-curious reader can actually do about it.
Why Currency Crises Happen: The Core Mechanics
Before we dive into numbers, let’s make sure we’re all on the same page about the machinery. A currency crisis typically unfolds through one of three well-studied channels — and sometimes all three at once:
Balance of Payments Crisis (First-Generation Model): A country runs chronic current account deficits, burns through foreign reserves defending a fixed or managed exchange rate, and eventually can no longer sustain the peg. The currency collapses. Think Mexico 1994.
Self-Fulfilling Speculative Attack (Second-Generation Model): Even with decent fundamentals, if market participants collectively believe a devaluation is coming, they short the currency en masse — and the expectation itself causes the crisis. The 1992 ERM crisis that famously broke the Bank of England fits here.
Balance Sheet Crisis (Third-Generation Model): Corporations or banks borrow heavily in foreign currency (usually USD) while earning revenues in local currency. When the exchange rate moves against them, their liabilities balloon and the financial system seizes up. Indonesia and South Korea in 1997–98 are textbook cases.
In 2026, the most dangerous environment for emerging markets combines elements of all three: elevated USD interest rates (the Fed funds rate is still sitting in a restrictive 4.25–4.50% range as of Q1 2026), persistent dollar strength, and corporate debt loads that ballooned during the ultra-cheap money era of 2020–2021.
The Key Risk Indicators to Watch in 2026
Let’s get specific. When analysts at the IMF, BIS, or a sell-side shop screen for currency crisis vulnerability, they’re typically running through a checklist of macroeconomic tripwires. Here’s what the dashboard looks like right now:
Foreign Reserve Cover: Less than 3 months of import cover is a classic danger zone. As of early 2026, Pakistan sits at roughly 2.1 months, Ethiopia at under 2 months, and several Sub-Saharan African nations remain critically low despite IMF support programs.
External Debt to GDP Ratio: When external debt crosses 60–70% of GDP and a large portion is short-term, rollover risk becomes acute. Argentina’s external debt (excluding IMF obligations) remains structurally problematic, hovering near 55% of GDP even after repeated restructurings.
Current Account Deficit: A deficit above 5% of GDP, if financed by volatile portfolio flows rather than stable FDI, is a warning flag. Egypt and Kenya are both navigating deficits in the 4–6% range under considerable stress.
Real Interest Rate Differential: Emerging market central banks need to offer sufficiently positive real rates to attract capital inflows. When the Fed holds rates high and a local central bank is forced to cut to stimulate growth, the differential narrows — and carry traders exit, weakening the currency.
Dollarization of Private Sector Debt: The share of corporate borrowing denominated in foreign currency. In Turkey, despite policy shifts, roughly 40% of the corporate sector’s liabilities remain FX-denominated as of 2026.
Country Case Studies: Who’s in the Hot Seat in 2026?
Let’s look at a handful of economies that are generating serious conversation among EM specialists right now.
Egypt: The Egyptian pound went through a painful managed devaluation cycle in 2023–2024 and has since stabilized under an IMF Extended Fund Facility. But the structural vulnerabilities haven’t disappeared. Tourism revenues and Suez Canal fees — Egypt’s two biggest FX earners — remain sensitive to geopolitical disruption. If either stumbles, the current account math gets ugly fast. As of Q1 2026, Egypt’s central bank holds approximately $38–40 billion in net foreign reserves, which sounds substantial but includes IMF drawings and FX swaps that aren’t freely usable. The net usable reserve picture is considerably thinner.
Turkey: Turkey has been the “perennial crisis candidate” of EM watchers for years, but the post-2023 policy pivot toward orthodox monetary policy has genuinely changed the picture. The central bank raised rates aggressively, and inflation, while still elevated (around 40% year-on-year in early 2026), has been trending down from its 85% peak. The lira has stabilized in a managed float. The risk now is political: if there’s pressure to ease rates prematurely ahead of any electoral cycle, the inflation-exchange rate feedback loop could re-ignite.
Nigeria: The naira’s multiple devaluation episodes in 2023–2024, and the subsequent unification of the exchange rate windows, were necessary but painful. Nigeria’s challenge in 2026 is the oil revenue paradox — the country sits on enormous hydrocarbon wealth but oil theft, pipeline vandalism, and underinvestment mean actual export volumes consistently disappoint. With oil production still below 1.5 million barrels per day against a budget assumption closer to 1.78 million, the fiscal and FX pressure is structural.
Pakistan: Pakistan completed its IMF Stand-By Arrangement in 2024 and is now in a longer-term Extended Fund Facility. Reserves have rebuilt somewhat, but the economy remains in a fragile equilibrium. Any external shock — an oil price spike, a drought that requires emergency food imports, or a geopolitical flare-up in the region — could rapidly erode the progress made.
The Systemic Risk Dimension: Contagion in 2026
Here’s where things get interesting from a global perspective. Currency crises rarely stay neatly contained within one country’s borders, especially in a world of instant capital flows and interconnected supply chains. The contagion mechanisms we need to think about in 2026 include:
Trade finance seizure: When a major EM economy’s currency crashes, letters of credit become difficult to issue, and regional trading partners see their exports disrupted.
Banking sector exposure: European banks — particularly from France, Spain, and Italy — have historically had significant loan books in EM economies. A systemic crisis in a major EM borrower can show up on European bank balance sheets uncomfortably quickly.
Commodity price feedback: Several vulnerable EM economies are commodity exporters. A currency crisis can actually temporarily boost their export revenues in local currency terms, but it also raises the cost of imported inputs, creating complex second-order effects.
Sentiment-driven selloffs: When one EM currency breaks down visibly, algorithmic and macro hedge fund strategies often trigger broader EM currency basket shorts, hitting even fundamentally sound economies like India, Brazil, or Indonesia with unjustified volatility.
Realistic Alternatives: What Can You Actually Do?
Okay, so we’ve established the landscape. Now the practical question: what does this mean for you specifically, depending on who you are?
If you’re an individual investor with EM exposure: Review your allocation to EM bond funds, particularly those with high weights in frontier markets or single-country EM ETFs. The difference between a “diversified EM” fund and one heavily concentrated in two or three vulnerable economies is enormous. Look at the fund’s hedge ratio and whether it has currency-hedged share classes. Also consider that some EM currencies — the Indian rupee, Brazilian real, and Indonesian rupiah — are in a fundamentally different category from the higher-risk names we’ve discussed. Don’t throw the baby out with the bathwater.
If you’re a business with cross-border supply chains: Now is an excellent time to audit your FX exposure map. Where are your key suppliers? Are you paying them in local currency or USD? If USD, you’re actually somewhat insulated from local currency crisis risk — but your supplier isn’t, and a crisis that devastates their working capital could disrupt your supply chain regardless of the currency denomination. Supplier diversification and building strategic inventory buffers are practical hedges here.
If you’re traveling to or relocating to an EM country: Currency crises create genuine logistical nightmares — ATM cash limits, parallel exchange rate markets, and sudden import restrictions on certain goods. If you’re going somewhere on the watchlist, keep a buffer of hard currency (USD or EUR cash, not just card), register with your home country’s embassy, and have contingency flights planned. It sounds dramatic, but it’s just sensible preparation.
If you’re a policy-curious reader: Push for coverage of IMF governance reform in your media consumption and civic engagement. The IMF’s lending facilities — particularly the Flexible Credit Line and the Resilience and Sustainability Trust — are genuinely useful tools, but access is too slow and stigmatized for many at-risk countries to use them preemptively. Reform here would actually reduce crisis frequency.
The Bigger Picture: Structural Solutions vs. Firefighting
It’s worth stepping back and acknowledging that the EM currency crisis cycle is, in many ways, a structural feature of the current international monetary system rather than a bug that can be fixed with better fiscal management alone. The dollar’s dominance in global trade invoicing and financial contracts means that when the Fed tightens, every dollar-indebted emerging economy faces a headwind that has nothing to do with their own policy decisions. This is what economists call the “original sin” problem — the inability of smaller economies to borrow internationally in their own currencies — and it hasn’t been solved in 2026, despite years of discussion about SDR reform and regional currency arrangements.
Progress is happening incrementally: ASEAN’s local currency transaction framework has expanded, the BIS’s regional reserve pooling mechanisms have deepened, and several EM central banks have built far more sophisticated FX derivative markets than existed a decade ago. But we’re not at the point where a developing economy can fully insulate itself from the transmission of US monetary policy. Understanding that context is essential for anyone trying to make sense of the headlines.
Editor’s Comment : Currency crises feel abstract until they’re not — until a remittance transfer to family abroad goes through at a rate 30% worse than it was six months ago, or until a factory that sources components from a crisis-hit country finds its supply chain suddenly broken. The goal of working through this analysis together isn’t to generate anxiety, but to build the kind of informed radar that turns a headline into actionable understanding. Watch the reserves, watch the real rate differentials, watch the political will behind orthodox policy — and when multiple signals align, take them seriously before the market does.
2026년 초, 한 중견기업 CFO가 동남아시아 법인에서 보내온 보고서를 받아들고 표정이 굳어졌다는 이야기를 들었어요. 현지 통화가 3개월 만에 달러 대비 18% 넘게 절하되면서 현지 매출은 그대로인데 본사로 송금하는 금액이 눈에 띄게 쪼그라든 거예요. 단순히 환율이 움직인 게 아니라, 그 나라의 외환보유고가 위험 수위 아래로 떨어졌다는 신호가 먼저 있었던 건데 그걸 미리 읽지 못한 거라고 봅니다. 이런 일이 특정 기업만의 문제일까요? 2026년 현재, 글로벌 긴축 사이클의 여파와 달러 강세 재점화, 그리고 지정학적 분절화가 맞물리면서 신흥국 통화위기 리스크는 다시 한번 시장의 핵심 화두로 떠오르고 있는 것 같습니다.
📊 본론 1 — 숫자로 읽는 2026년 신흥국 통화 취약성
통화위기를 판단할 때 가장 먼저 봐야 할 지표는 외환보유고 대비 단기외채 비율(Guidotti-Greenspan Rule)이에요. 이 비율이 1 미만이면 1년 안에 갚아야 할 외채를 보유 달러로 감당할 수 없다는 뜻인데, 2026년 1분기 기준으로 몇 가지 주목할 수치가 있어요.
이집트: 외환보유고 약 350억 달러 수준이지만 단기외채와 IMF 상환 일정이 겹치며 실질 가용 외환은 훨씬 낮다는 추정이 나옵니다. 파운드화는 2025년 대비 누적 절하폭이 20%를 웃돌고 있어요.
파키스탄: IMF 구제금융 프로그램 연장에 성공했지만, 외채 상환 부담이 GDP의 약 28%에 달하는 구조적 취약성이 여전합니다. 루피화 변동성 지수(1개월 내재 변동성)는 연초 기준 14%대를 기록 중이에요.
나이지리아: 나이라화 공식·비공식 환율의 이중구조가 완전히 해소되지 않았고, 원유 수출 수익 감소와 보조금 개혁 후유증이 겹쳐 있어요. 달러 대비 나이라는 2025년 말 대비 약 12% 추가 절하 압력을 받고 있다는 분석이 나옵니다.
아르헨티나: 밀레이 정부의 페소화 자유화 정책 이후 공식 환율은 안정세를 찾는 것처럼 보이지만, 인플레이션이 여전히 100% 안팎을 오가며 실질 구매력 하락이 지속되고 있어요.
터키: 리라화는 정책금리 인하 실험에서 급선회한 고금리 정책(2026년 현재 기준금리 42.5% 수준)으로 명목 안정세를 유지하고 있으나, 경상수지 적자 구조와 인플레이션 압력은 여전히 잠재 리스크로 남아 있는 것 같습니다.
여기서 중요한 논리적 연결고리가 있어요. 이 나라들의 공통점은 단순히 ‘가난한 나라’가 아니라, 달러 표시 부채 비중이 높고 경상수지 적자가 구조화된 상태에서 미 연준의 고금리 장기화 기조에 직격탄을 맞은 구조라는 점이에요. 달러가 강세를 유지할수록 이 나라들의 채무 상환 부담은 자국 통화 기준으로 눈덩이처럼 불어납니다. 이를 ‘원죄(Original Sin)’라고 부르는데, 자국 통화로 국제 차입을 못 하는 신흥국의 고질적 구조적 한계를 지칭하는 개념이에요.
🌍 본론 2 — 과거 위기에서 배우는 패턴, 그리고 2026년의 변수
신흥국 통화위기에는 반복되는 패턴이 있어요. 1997년 아시아 외환위기, 1998년 러시아 루블 위기, 2001년 아르헨티나 페소화 붕괴, 2018년 터키·아르헨티나 동시 위기… 모두 다른 것처럼 보이지만 공통 구조가 있습니다.
① 달러 강세 + 글로벌 유동성 축소 → ② 자본 이탈 가속 → ③ 외환보유고 급감 → ④ 환율 방어 실패 → ⑤ IMF 구제금융 또는 디폴트라는 다섯 단계의 연쇄 반응이에요. 2022~2023년에 스리랑카와 잠비아, 가나가 이 경로를 그대로 밟았고, 그 여파가 2026년 현재도 채무 재조정 협상 형태로 진행 중인 경우가 있습니다.
그런데 2026년의 변수는 여기에 두 가지 새로운 층위가 추가된다는 점이에요.
첫째, 중국 위안화와 위안화 블록의 부상이에요. 아프리카와 중앙아시아 일부 신흥국은 중국으로부터의 차입 비중이 높아져 ‘달러 위기’가 아닌 ‘위안화 부채 딜레마’라는 새로운 유형의 취약성을 갖게 됐어요. 달러 절상이 완화돼도 위안화 변동성이 연동된 나라에는 다른 경로의 압박이 올 수 있다는 분석이 있습니다.
둘째, 지정학적 분절화(Geo-economic Fragmentation)예요. IMF가 2025년 보고서에서도 강조했듯, 미국·중국·유럽으로 나뉜 공급망 재편 구도에서 어느 블록에도 명확히 편입되지 못한 중간 신흥국들은 수출 다변화가 어려워지고 있어요. 이는 경상수지 적자를 구조적으로 심화시키는 요인이 된다고 봅니다.
💡 결론 — 리스크를 알았다면, 현실적으로 어떻게 대응할까
신흥국 통화위기 리스크를 분석하는 건 막연한 공포심 때문이 아니라, 실질적인 자산 배분과 사업 전략에 반영하기 위해서라고 봐요. 개인 투자자든, 해외 사업을 운영하는 기업이든 다음과 같은 접근이 현실적인 것 같습니다.
신흥국 채권 투자 시: 달러 표시 국채(하드커런시)와 현지 통화 국채(로컬커런시)를 구분해서 보세요. 전자는 환위험이 없지만 해당국 신용등급 하락 리스크가 있고, 후자는 통화 절하 자체가 직격탄이 됩니다. 취약국 비중은 포트폴리오의 5~10% 이내로 제한하는 게 통상적인 가이드라인이에요.
해외 사업 현금 관리: 취약 통화 국가의 법인 현금은 현지에 장기 보유하기보다 빠르게 달러 또는 유로로 환전해 본사 계좌로 송금하는 ‘제로-잔고 정책(Zero Balance Policy)’을 검토할 만 합니다.
환헤지 수단 활용: 선물환(Forward) 계약이나 통화옵션(Currency Option)을 이용한 헤지는 비용이 발생하지만, 극단적 절하 시나리오 대비 보험으로서의 가치가 있어요. 특히 거래 규모가 큰 기업이라면 필수적이라고 봅니다.
모니터링 지표 설정: CDS(신용부도스왑) 스프레드, 외환보유고 월간 변동, IMF SDR 인출 여부, 중앙은행 긴급 금리 인상 여부 등을 정기적으로 체크하는 조기경보 체계를 만들어두면 좋아요.
분산 투자의 재확인: 특정 지역에 쏠린 신흥국 노출도를 점검하고, 아시아·중남미·아프리카·중동으로 지리적 분산이 이뤄져 있는지 확인하세요. 상관관계가 낮은 자산끼리 묶는 게 핵심입니다.
신흥국 통화위기는 멀리 있는 남의 나라 이야기가 아니에요. 우리나라 수출 기업들의 해외 매출, 연기금의 글로벌 포트폴리오, 그리고 개인 투자자들의 ETF까지 — 생각보다 촘촘하게 연결돼 있거든요. 무조건 피하는 것도 답이 아니고, 무심코 노출돼 있는 것도 위험합니다. 정확히 어디에 얼마나 노출됐는지를 파악하는 것, 그게 시작이라고 봐요.
에디터 코멘트 : 신흥국 투자나 사업을 완전히 포기하라는 말이 아니에요. 위기의 구조를 이해하면 오히려 저평가된 자산에서 기회를 잡는 시각도 생기거든요. 1998년 아시아 외환위기 직후 한국 주식을 사들인 투자자들이 결국 가장 큰 수익을 냈다는 사실을 기억해 두셨으면 해요. 리스크 분석은 공포가 아니라 냉정한 계산을 위한 도구입니다.
Let me take you back to early 2020, when a colleague of mine — a seasoned investor with nearly two decades of experience — watched helplessly as WTI crude oil futures briefly turned negative for the first time in history. He hadn’t hedged his positions, dismissed the supply glut warnings, and ended up absorbing losses that wiped out three years of gains in a single month. That story has stuck with me, and honestly, it’s the reason I think every serious investor needs a battle-tested risk management framework before touching commodity markets in 2026.
Commodity investing is genuinely exciting — raw materials like copper, lithium, gold, and agricultural products sit at the foundation of the global economy. But that same foundational quality makes them wildly sensitive to geopolitical shocks, weather events, currency fluctuations, and policy shifts. So let’s think through this carefully together.
Why Commodity Risk Is Structurally Different from Equities
When you buy a stock, you’re buying a slice of a business that can adapt — it can cut costs, pivot its model, or raise prices. A barrel of oil or a bushel of wheat can’t do any of that. Commodity prices are determined almost entirely by supply-demand imbalances and external macro forces, which creates a unique risk profile:
Price Volatility: The Bloomberg Commodity Index logged annualized volatility of roughly 18–22% through early 2026, compared to around 15% for the S&P 500 over the same trailing period. Short-term swings can be dramatically larger during crisis events.
Geopolitical Risk: The ongoing Red Sea shipping disruptions and OPEC+ production quota disputes in 2026 have again demonstrated how quickly supply chains can tighten and prices spike.
Currency Risk: Most commodities are priced in USD. A strengthening dollar — as seen during the Fed’s prolonged tightening cycle — generally suppresses commodity prices, even when physical demand remains strong.
Contango and Backwardation: If you invest through futures-based ETFs (like many retail investors do), roll costs in a contango market can silently erode your returns even when the spot price moves in your favor.
Regulatory and ESG Risk: In 2026, carbon pricing mechanisms in the EU and proposed similar frameworks in South Korea and Japan are reshaping the cost structures of fossil fuel commodities significantly.
Core Risk Management Frameworks Worth Adopting
Let’s get practical. Risk management in commodities isn’t just about “don’t put all your eggs in one basket” — it’s a multi-layered discipline.
1. Position Sizing Based on Volatility (ATR Method): Rather than allocating a fixed dollar amount to each commodity, consider sizing positions based on the Average True Range (ATR) — a measure of recent price volatility. The idea is simple: if copper is twice as volatile as gold right now, you’d hold roughly half the copper position to maintain equal risk exposure across both. This is how professional commodity trading advisors (CTAs) typically operate.
2. Diversification Across Commodity Sectors: Energy, metals, agriculture, and soft commodities often behave very differently. In 2026, for instance, lithium and rare earth metals have surged alongside EV battery demand, while natural gas prices in Europe remain elevated due to persistent supply constraints — but these two trends are largely uncorrelated. Spreading exposure across sectors meaningfully reduces portfolio-level drawdown risk.
3. Hedging with Options: Buying put options on commodity ETFs (such as GLD for gold or PDBC for diversified commodities) caps your downside while keeping upside exposure intact. Yes, there’s a premium cost — think of it as insurance. For investors holding physical commodity ETFs, purchasing 3–5% out-of-the-money puts on a rolling quarterly basis has historically reduced maximum drawdowns by 30–40%.
4. Stop-Loss Discipline: This sounds basic, but studies of retail commodity investors consistently show that the biggest losses come from failing to exit losing positions. A pre-committed stop-loss at 10–15% below entry — set at the time of purchase, not emotionally afterward — is one of the highest-return risk management tools available.
Real-World Examples: Learning from 2025–2026 Markets
Let’s ground this in recent events, because theory only gets you so far.
Korea’s POSCO Holdings and Lithium Exposure: POSCO has been one of the most watched cases in domestic Korean investment circles. Their direct investment in lithium extraction projects in Argentina gave them significant commodity price exposure. When lithium carbonate prices dropped sharply in late 2024 and continued softening through 2025, POSCO’s commodity-linked earnings took a visible hit. However, their strategic use of long-term supply contracts with fixed pricing bands — a form of natural hedging — limited the damage compared to pure commodity speculators. The lesson: operational hedging through contract structure is as valuable as financial hedging.
Glencore’s Dynamic Rebalancing: The Swiss-headquartered commodity giant Glencore continues to serve as a masterclass in portfolio-level risk management. In their 2025 annual report, they highlighted how their marketing (trading) division consistently profits even in commodity downturns by exploiting price differentials across geographies and time periods — essentially arbitraging volatility. For retail investors, this suggests that commodity-linked company stocks (as opposed to pure futures ETFs) can offer a more managed risk profile, since the company itself is already running internal hedges.
Gold’s Role as a Safe Haven in 2026: Gold broke through the $3,100/oz level in Q1 2026, driven by continued global central bank accumulation and persistent inflation anxiety. Investors who allocated just 5–10% of their broader portfolio to gold as a hedge — not as a primary bet — found meaningful protection during the equity market corrections in late 2025. This is the portfolio hedge use case working exactly as intended.
Realistic Alternatives for Different Investor Profiles
Not everyone should be directly trading commodity futures. Here’s how I’d tailor the approach depending on where you are in your investment journey:
Beginners: Start with commodity-linked equity ETFs (e.g., energy sector ETFs or mining company ETFs) rather than futures-based products. You get commodity exposure with less complexity and no roll-cost drag.
Intermediate Investors: Consider a multi-asset allocation model where commodities represent 10–15% of your overall portfolio, diversified across energy, metals, and agriculture. Use broad commodity ETFs like PDBC or iShares GSCI Commodity Dynamic Roll ETF as your base.
Experienced Investors: Direct futures trading or options strategies become appropriate, but only with strict position sizing rules and a pre-defined risk budget (e.g., “I will not risk more than 2% of my total portfolio on any single commodity trade”).
Risk-Averse Investors: Commodity-linked bonds or structured notes with principal protection can offer indirect exposure with capped downside — worth exploring with a financial advisor.
The bottom line is this: commodity investing in 2026 rewards those who respect the market’s complexity and plan for chaos before it arrives. The tools — diversification, position sizing, hedging, and disciplined exit rules — aren’t glamorous, but they’re what separate investors who survive volatile cycles from those who don’t.
Think of risk management not as a constraint on your returns, but as the infrastructure that lets you stay in the game long enough for your good ideas to actually pay off.
Editor’s Comment : The single most underrated risk management tool for commodity investors in 2026 isn’t a sophisticated derivative strategy — it’s simply writing down your investment thesis and your exit criteria before you enter a position. When markets get chaotic (and they will), that written plan becomes the rational voice that drowns out fear and greed. Start there, and layer in the more advanced techniques as your experience grows.