A friend of mine — a sharp-eyed grocery manager in suburban Chicago — called me a few weeks ago, half frustrated, half bewildered. “I haven’t changed a single thing about how I run this store,” he said, “but my customers are flinching at the register like it’s 2022 again.” He wasn’t imagining it. I’d been watching the same data he was feeling in real time, and honestly, 2026 has thrown a curveball that almost nobody saw coming at the start of the year. So let’s dig into what’s actually happening with inflation and consumer prices right now — because this story is moving fast.
From Cautious Optimism to a Price Spike: The 2026 CPI Trajectory So Far
The year started with a real sense of relief. The all-items Consumer Price Index for All Urban Consumers increased 2.4 percent over the 12 months ending January 2026, after rising 2.7 percent for the year ending December 2025. That was a welcome sign of disinflation. Economists were cautiously optimistic — tariff pressures were fading, energy markets were calm, and the Fed seemed closer to threading the needle.
Then February came and held steady. The annual inflation rate in the US held steady at 2.4% in February 2026, unchanged from January, in line with expectations and remaining at its lowest level since May 2025. But beneath that calm surface, pressure was building. On the eve of the conflict, the February CPI report showed continued passthrough of tariffs into consumer inflation, at an accelerating rate.
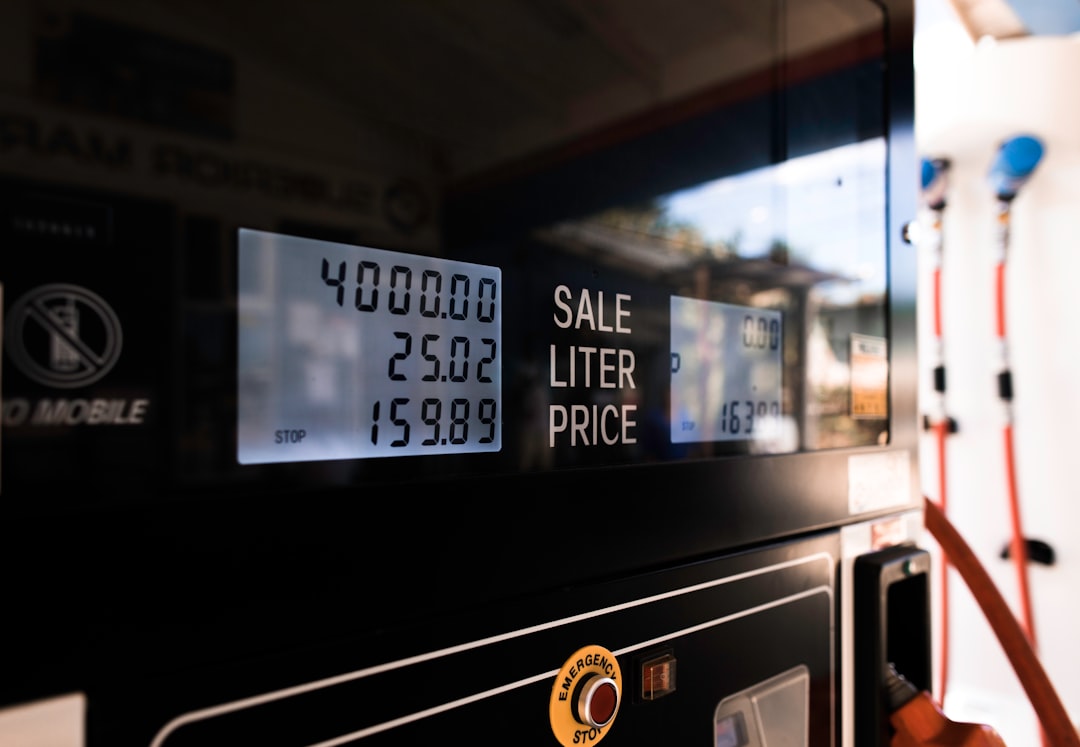
Then March delivered a shock. Headline Consumer Price Index (CPI) surged 0.9% month over month (m/m) in March, the largest increase since June 2022, pushing headline inflation up 0.9 percentage points (ppt) to 3.3% year over year (y/y). The primary villain? Energy. The Iran conflict was the story for the monthly inflation reading, as gasoline soared 21.2%, accounting for nearly three-quarters of the headline price increase, according to the BLS.
The Iran War & the Strait of Hormuz: The Energy Shock Explained
If you want to understand what’s happening at the pump — and in your grocery cart — you need to understand the geopolitics playing out in the Persian Gulf. Iran has effectively choked off ship traffic through the Strait of Hormuz, a waterway used to transport about a fifth of the world’s oil supply. The consequences rippled through global markets almost immediately. Oil prices — as measured by Brent crude oil, a global price benchmark — spiked to $118 per barrel by the end of March from roughly $70 per barrel before the conflict began. Prices have since declined, but remain elevated at around $96.
What’s particularly tricky here is the lag effect. Some of the inflationary effects of energy prices may take months to feed through supply chains and flow through to consumers’ wallets. Think about it like a pipeline — crude hits the refinery, which adjusts jet fuel and diesel pricing, which then hits freight costs, which finally lands on retail shelf prices. It’s a slow burn with a wide blast radius.
While the U.S. and Iran agreed to a two-week ceasefire late Tuesday, economists said that the inflationary effects of the war will likely take several weeks or months to unwind — and that a prolonged conflict risks raising consumer prices more broadly, to areas like food, airfare and manufactured goods.
Breaking Down the Key CPI Components in 2026
Not all price pressures are equal right now. Let’s look at where the heat is actually concentrated:
- Energy: The index for energy rose 10.9 percent in March, led by a 21.2-percent increase in the index for gasoline which accounted for nearly three quarters of the monthly all items increase.
- Core CPI (ex-food & energy): Core prices rose much less — just 0.2% for the month and 2.6% from a year ago, both 0.1 percentage point below forecast, indicating that underlying inflation was contained.
- Food at home vs. away from home: In 2026, prices for all food are predicted to increase 3.6%, with food-at-home prices predicted to increase 3.1% and food-away-from-home prices predicted to increase 3.9%.
- Shelter: Core CPI rose a contained 0.2% m/m, as tariff-induced pressures in select goods categories and some firming in travel-related costs were offset by disinflation in housing.
- Apparel (tariff pass-through): Core goods prices edged higher, with apparel prices rising 1.0%, likely reflecting ongoing tariff passthrough.
- E-commerce surcharges: Amazon will start levying a 3.5% fuel and logistics surcharge for third-party sellers in the U.S. and Canada on April 17.
- Used vehicles: Used car prices declined 0.4% for a second consecutive month, while new car prices were flat — a rare bright spot in the current data.
Global CPI Comparison: How Does the U.S. Stack Up?
It’s worth zooming out and looking at the global picture, because inflation in 2026 is decidedly not a one-country story. Year-on-year headline inflation in the OECD as measured by the Consumer Price Index (CPI) decreased to 3.3% in January 2026, from 3.6% in December 2025. That earlier downward momentum, however, is now under significant pressure from the Middle East energy shock.
In 2026, core CPI is expected to be 2.8% globally, 3.2% in the U.S., 2.4% in the U.K. and 1.9% in the euro area. J.P. Morgan’s research desk captures the regional divergence well: There will likely be disparate outcomes across regions, with inflation projected to accelerate in the U.S. and moderate in Europe.
The global inflation forecast for 2026 is mixed, with subdued inflation in Asia and Europe and above-target levels in America. China, notably, is practically fighting deflation — among non-OECD G20 economies, headline inflation in China fell to 0.2%, down 0.3 p.p. from January of the previous year, after a year that saw little overall price growth.
What Are Analysts Forecasting for the Rest of 2026?
Forecasters are working with a rare degree of uncertainty right now, because so much depends on geopolitical variables that are genuinely unpredictable. Here’s the range of scenarios:
- Best case (short conflict): If the conflict stops by the end of April and the Strait of Hormuz gradually opens, CPI inflation would likely decline “relatively quickly.” One Capital Economics analyst expects it to peak at about 4% and drop to 3% by the end of 2026.
- Base case: A longer conflict that inflicts minor damage to energy infrastructure could lead U.S. oil prices to average about $100 per barrel for the rest of the year, with CPI inflation rising to 3.5% by the end of 2026.
- Food prices outlook: Higher fertilizer costs are likely to push crop prices, and ultimately food prices, higher in the coming months. EY expects food inflation to rise from just below 3.0% y/y in March to just above 4% in the near term.
- Fed policy implications: Markets already had been pricing little chance of a rate cut through the rest of 2026, though Fed officials at their March meeting indicated a tilt toward a quarter percentage point reduction, with the timing highly uncertain.
- J.P. Morgan’s global monetary outlook: Disparate inflation outcomes will likely result in divergent monetary policy among global central banks in 2026. In light of inflationary pressures in the U.S., J.P. Morgan Global Research expects the Fed to remain on hold this year.
Practical Strategies for Consumers and Investors Right Now
Knowing that inflation is elevated is one thing. Actually navigating it is another. If you’re trying to protect your purchasing power — or at minimum, not get blindsided by the next grocery run — here are some grounded approaches:
- Lock in energy costs where possible: Fixed-rate utility plans, pre-purchased heating oil contracts, and fuel-efficient vehicles all create a buffer against energy price volatility.
- Reassess discretionary e-commerce spending: With fuel surcharges being added by major carriers and platforms, the “free shipping” math is quietly shifting. Factor in the real delivered cost.
- Watch core CPI, not just headline: Excluding food and energy, core prices rose just 0.2% for the month and 2.6% from a year ago — both 0.1 percentage point below forecast, indicating that underlying inflation was contained. That means structural inflation is still manageable; the volatility is largely geopolitical and energy-driven.
- Consider TIPS or I-Bonds for savings: Treasury Inflation-Protected Securities remain one of the most straightforward tools for individual savers in high-inflation environments.
- Use real-time data tools: The Federal Reserve Bank of Cleveland provides daily “nowcasts” of inflation for two popular price indexes, the PCE and the consumer price index (CPI) — a valuable free resource at clevelandfed.org for anyone wanting to track inflation before the official monthly releases.
The Bigger Picture: Where Do We Go From Here?
Even if the geopolitical situation stabilizes, the inflation story of 2026 isn’t over. Despite the recent slowdown in headline inflation, average price levels across the OECD stood 35.6% higher in January 2026 than in December 2019, before the onset of the COVID-19 pandemic. That accumulated price level is the “new normal” that consumers and businesses have to operate within — and it’s why even moderate inflation rates feel so painful today.
J.P. Morgan’s Seydl used the expression “up like a rocket and down like a feather” to describe the likely price dynamics — meaning even after the energy shock fades, don’t expect prices at the gas station or grocery store to come tumbling back down fast. History backs that up. Prices are sticky in one direction.
Rather than assuming inflation will simply resolve itself, the smarter move is to treat 2026 as a year of active risk management. If you’re a business owner, pricing strategy reviews and supply chain diversification are no longer optional exercises. If you’re a household budgeter, building a 3-month buffer on staples — not panic-buying, just steady stocking — provides genuine optionality when the next shock hits.
Editor’s Comment : The March 2026 CPI report is a stark reminder that inflation in this decade doesn’t follow a neat, linear path back to 2%. It’s episodic, geopolitically entangled, and structurally stickier than we’d like. The good news? The core inflation signal — the “heartbeat” of structural price pressure — remains relatively tame at 2.6%, which means this isn’t a repeat of the broad-based inflationary spiral of 2021–2022. Keep one eye on the Strait of Hormuz and one on your household budget. And if you want to track this in real time, bookmark the BLS CPI release calendar and the Cleveland Fed’s inflation nowcasting page — they’ll give you a heads-up before the headlines do.
📚 관련된 다른 글도 읽어 보세요
- Is Inflation Coming Back? A Hard Look at the Macro Forces Shaping 2026
- 공급망 이미 터졌다: 호르무즈·관세·희토류 3중 충격, 2026년 한국 기업 생존 전략 완전 정리
- 2026 Commodity Market Analysis & Oil Price Forecast: What the Data Is Actually Telling Us Right Now
태그: 2026 inflation trends, consumer price index 2026, CPI forecast 2026, energy prices inflation, global inflation outlook 2026, food price inflation, Federal Reserve interest rates 2026
Leave a Reply