작년에 직장 동료 한 명이 이런 말을 했다. “주식도 떨어지고, 채권도 떨어지는데 대체 뭘 사야 하냐”고. 그 친구는 S&P500 ETF 하나만 들고 있다가 호르무즈 해협 봉쇄 여파로 포트폴리오가 박살나는 걸 목격한 케이스다. 그때 내가 가장 먼저 던진 말은 딱 하나였다. “원자재 들어가 있어?”
2026년 지금, 인플레이션은 3%대를 다시 넘어섰고, 에너지 가격은 요동치고 있다. 주식·채권 동시 하락장에서 살아남는 방법, 솔직히 딱 하나다. 원자재 헤지 포지션. 근데 막연하게 “금 사면 되지”라고 생각하는 사람들, 이 글 끝까지 읽어야 한다. 그 생각이 당신 계좌에 구멍을 낼 수 있다.
📌 목차 (TOC)
- ① 2026년 왜 지금 원자재인가 — 수치로 보는 인플레이션 현실
- ② 원자재 헤지 핵심 ETF 5종 완전 비교 (GLD, IAU, PDBC, GDX, COPX)
- ③ 금 vs 원자재 광주리, 진짜 헤지는 뭔가 — 모닝스타 데이터 분석
- ④ 구리·은·에너지: 2026년 주목할 ‘숨은 원자재’ 3총사
- ⑤ 원자재 투자 전 절대 하지 말아야 할 실수 7가지
- ⑥ FAQ — 독자들이 가장 많이 묻는 것들
- ⑦ 결론 및 에디터 코멘트
① 2026년 왜 지금 원자재인가 — 수치로 보는 인플레이션 현실
미국 헤드라인 인플레이션은 5개월 만에 3%대에 재진입했으며, 에너지 급등과 관세 영향이 지속되는 가운데 연료 가격이 월간 기준 +21.5% 급등했고, 전기요금도 다시 상승 전환했다. 이건 그냥 ‘잠깐의 변동’이 아니다. 구조적 문제다.
금값 랠리 배경에는 중앙은행의 금 매입, 지정학적 불확실성, 인플레이션 헤지 수요, 미국 연준의 금리 인하 등이 복합적으로 작용했다. 단일 요인이 아니라는 뜻이다. 그리고 이건 단기간에 해소될 구조가 아니다.
금과 은, 구리 같은 귀금속과 원자재가 강세를 보이는 것은 인플레이션 상승과 달러 약세를 예상하는 투자자들이 많기 때문이며, 골드만삭스는 특히 구리에 강세를 전망하고 있는데, 이는 전력망·냉각 인프라 등 AI 투자 확대에 따라 구리가 단순 경기 민감 원자재를 넘어 AI 인프라 필수 자원으로 재평가받고 있기 때문이다.
2026년 원자재 ETF 투자의 논거는 인플레이션 서프라이즈, 지정학적 충격, 실질금리 기대 변화를 견딜 수 있는 포트폴리오를 구축하는 것에 집중된다.
② 원자재 헤지 핵심 ETF 5종 완전 비교 (GLD, IAU, PDBC, GDX, COPX)
원자재 ETF는 금속, 에너지, 농산물에 직접 소유 부담 없이 노출을 제공하며, 금과 은은 보관이 가능하지만 원유·천연가스·밀 같은 원자재는 실물 보유가 현실적으로 불가능하기 때문에 ETF가 실용적인 대안이 된다. 이 펀드들은 주식·채권과의 낮은 상관관계 덕분에 분산 효과를 제공하고, 물가 상승 시 원자재도 함께 오르는 특성 때문에 인플레이션 헤지 수단으로 기능한다.
| ETF 티커 | 운용사 | 추적 자산 | 1년 수익률 | 운용 보수 (Expense Ratio) | 주요 특징 |
|---|---|---|---|---|---|
| GLD | SPDR (State Street) | 금 현물 | 약 +73% | 0.40% | 금 실물 백드, 유동성 최강 |
| IAU | iShares (BlackRock) | 금 현물 | 약 +73% | 0.25% | GLD보다 낮은 보수, 장기 보유 적합 |
| PDBC | Invesco | 14종 원자재 선물 | 약 +17.8% | 0.59% | 에너지·금속·농산물 분산, K-1 미발행 |
| GDX | VanEck | 금광 주식 | 약 +129.8% | 0.51% | 금 가격 레버리지 효과, 변동성 높음 |
| XLE | SPDR (State Street) | 에너지 주식 | 약 +27% | 0.08% | 배당 수익, 최저 보수, 에너지 인플레 헤지 |
※ 수익률은 2026년 4월 기준 최근 1년 기준 참고치. 과거 수익률이 미래를 보장하지 않습니다.
PDBC(Invesco Optimum Yield Diversified Commodity Strategy)는 가솔린, 브렌트유, WTI 원유, 천연가스, 금, 옥수수, 대두, 소맥, 설탕, 아연, 알루미늄, 구리, 은 등 14개 주요 원자재 선물을 포함하며, 만기 교체 과정에서 발생하는 롤 수익률 손실을 최소화하는 ‘옵티멈 일드’ 전략이 차별점이다. 운용 보수는 0.59%로 원자재 ETF 기준 상당히 합리적이다.
GDX는 금의 주식 레버리지 표현으로, 금 가격이 오르고 비용이 안정될 때 광산 회사들은 마진을 빠르게 확대할 수 있어 주가가 금 자체보다 큰 폭으로 상승할 수 있다. 다만 광산 주식은 운영·정치·금융 리스크에 노출되어 있으며, 2026년에는 핵심 금 포지션을 보완하는 위성(Satellite) 포지션으로 사용하는 것이 가장 적합하다.
③ 금 vs 원자재 광주리 — 진짜 헤지는 뭔가
“금이 최고의 인플레이션 헤지”라는 말, 절반만 맞다. 실제 데이터는 다른 이야기를 한다.
모닝스타 데이터에 따르면, 원자재는 5번의 고인플레이션 구간 모두에서 인플레이션을 상회했지만, 금은 그 중 2번의 구간에서 뒤처졌다. 즉, 광주리형 원자재 ETF가 금 단일 투자보다 더 안정적인 인플레이션 헤지였다는 뜻이다.
금은 1980년대나 2021~2022년 일부 시기처럼 경쟁적인 금리 수익률이 자본을 빼앗아 갈 때 인플레이션 대비 약 40%의 고인플레이션 구간에서 뒤처졌다. 반면 천연자원 펀드는 원자재 바스켓을 통해 더 일관된 헤지를 제공하며 금리 인상 환경에서도 수요가 안정적인 구간에서 방어력을 발휘한다.
2026년에도 금은 인플레이션과 통화 가치 하락에 대한 ‘헤지’로 널리 인식되며, 재무 어드바이저들은 총 포트폴리오의 5~10%를 금 ETF에 배분하도록 권고하는데, 이는 위기 상황에서 주식·채권과 반대 방향으로 움직여 전체 변동성을 낮추는 효과 때문이다.
실제로 금은 지난 1년간 73%의 수익률을 기록했으며, 2026년 2월 20일 기준 연초 이후(YTD) 수익률도 18%에 달해 대부분의 전통 자산군을 압도했다.
④ 구리·은·에너지: 2026년 주목할 ‘숨은 원자재’ 3총사
🔴 구리 (Copper) — AI 시대의 숨은 수혜자
골드만삭스 전망에 따르면 2030년까지 구리 수요 증가분의 60%는 글로벌 전력 인프라 투자가 차지할 전망이며, 런던금속거래소(LME) 구리 현물 가격은 40% 가까이 급등한 바 있다. 그럼에도 신규 광산 부족과 소극적인 개발로 공급 탄력성이 제한적이어서 강세 전망이 지속되고 있다.
비철금속은 금리 환경과 무관하게 구조적 수급 문제로 가격 상승 동력을 갖는다는 점에서 차별화된 평가를 받고 있다.
⚪ 은 (Silver) — 변동성 크지만 업사이드도 크다
은은 지난 1년 동안 무려 122%의 수익률을 기록했지만, 단 한 달 만에 16% 이상 하락하는 폭락 장면도 연출했다. 은은 금보다 산업재 수요(전자기기, 태양광 패널)와 귀금속 수요가 동시에 얽혀 있어 변동성이 크다. 단기 트레이딩보단 분할 매수가 정석이다.
⛽ 에너지 (Energy) — 지정학이 계속되는 한 가장 빠른 헤지
인플레이션 헤지를 빠르게 실행하고자 하는 투자자에게 원유는 원자재 군 내에서 가장 빠르게 움직이는 자산이다. XLE는 원자재 ETF가 아닌 에너지 주식 ETF지만 원자재 베타를 확보하는 가장 유동적인 도구 중 하나이며, 에너지 가격 주도 인플레이션 기간에는 광범위한 주식 시장보다 빠르게 재가격화가 이루어지고 현금흐름 연계성이 부분적인 헤지 역할을 한다.
⑤ 원자재 투자 전 절대 하지 말아야 할 실수 7가지
- ❌ “금 하나면 됐지” 단일 자산 집중 투자 — 금은 5번 중 2번은 인플레이션을 따라가지 못했다. 분산이 답이다.
- ❌ 콘탱고(Contango) 무시하고 선물 ETF 장기 보유 — 선물 계약에 투자하는 ETF 투자자에게 롤 수익률은 중요한 수익 영향 요인이며, 원월물이 근월물보다 비싼 콘탱고 상태에서는 계약 만기 시 낮게 팔고 높게 사는 부정적 롤 비용이 발생한다. 장기 보유 시 수익이 조용히 녹아 없어진다.
- ❌ 레버리지 원자재 ETF 장기 보유 — 레버리지 상품은 변동성 확대 시 원금 손실 위험이 크므로 짧은 호흡으로 대응해야 한다.
- ❌ 세금 구조 확인 없이 파트너십 구조 ETF 매수 — 귀금속 현물을 직접 보유하는 ETF는 세금 규정상 수집품으로 분류되어 더 높은 양도소득세율이 적용될 수 있다.
- ❌ 포트폴리오의 20% 이상을 원자재에 한꺼번에 배분 — 위험 조정 기준으로 금과 원자재 모두 장기적으로 특별히 매력적인 성과를 내지는 못했으며, 대부분의 장기 투자자는 포트폴리오의 소수 비율로 제한하는 게 적절하다.
- ❌ ETF 괴리율·거래량 무시하고 뇌동 매매 — 변동성 장세에서 괴리율이 커지면 원하는 가격에 체결 자체가 안 된다.
- ❌ 지정학적 이벤트 이후 고점 추격 매수 — 단기 급등에 따른 차익 실현 매물 출회 가능성을 염두에 둔 분할 매수 전략이 실무적으로 권고된다.
📊 원자재 투자 방식별 장단점 비교표
| 투자 방식 | 진입 난이도 | 인플레이션 헤지 효과 | 유동성 | 세금/비용 | 추천 대상 |
|---|---|---|---|---|---|
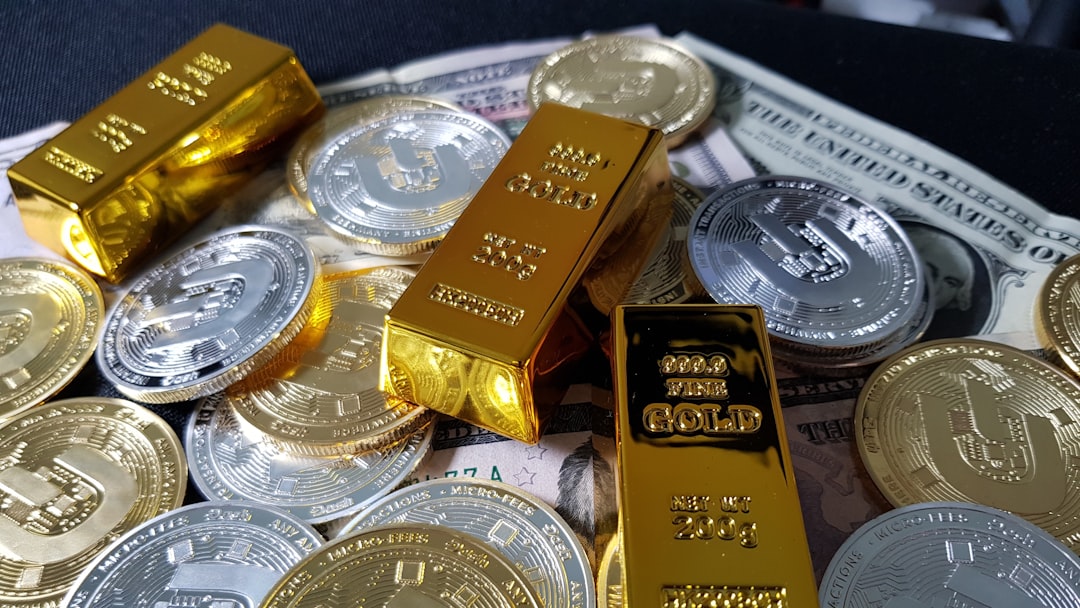
| 금 실물 (골드바/코인) | 낮음 | 중간 (변동적) | 낮음 | 보관비용, 세금 복잡 | 초장기 안전자산 선호자 |
| 금 ETF (GLD, IAU) | 낮음 | 중간 | 매우 높음 | 운용 보수 0.25~0.40% | 금 헤지를 ETF로 원하는 투자자 |
| 광주리형 원자재 ETF (PDBC) | 중간 | 높음 (일관성↑) | 높음 | 운용 보수 0.59%, 세금 단순 | 분산 인플레이션 헤지 원하는 투자자 |
| 광산주 ETF (GDX) | 중간 | 높음 (레버리지 효과) | 높음 | 운용 보수 0.51% | 공격적 수익 원하는 투자자 |
| 원자재 선물 직접 거래 | 매우 높음 | 가장 직접적 | 높음 | 롤 비용, 마진 콜 위험 | 전문 트레이더 |
🙋 FAQ — 독자들이 가장 많이 물어보는 것들
Q1. 금 ETF와 광주리형 원자재 ETF 중 어느 게 인플레이션 헤지로 더 좋나요?
데이터는 광주리형 원자재 ETF의 손을 들어준다. 인플레이션에 맞서는 데 있어 천연자원 ETF는 금 단독보다 더 강력한 실적을 보여주며, 금이 극한의 위기에서 빛난다면 광주리형 원자재는 일상적 인플레이션 압박에서 더 뛰어나 인플레이션 상승 구간의 90%에서 아웃퍼폼했다. 두 가지를 조합하는 코어-새틀라이트 전략이 현실적이다.
Q2. 원자재 ETF를 포트폴리오의 몇 퍼센트나 담아야 할까요?
기관 투자자들 사이에서 일반적인 원자재 배분 범위는 분산 포트폴리오의 5~10%이며, 위험 선호도에 따라 조정된다. 개인 투자자라면 이를 기준으로 삼되, 주식·채권 상관관계가 역사적으로 높은 수준을 유지한다면, 금의 분산 효과와 좌측 꼬리 헤지 역할이 더욱 중요해진다. 변동성을 감당할 수 있는 범위 내에서 접근하는 게 정석이다.
Q3. 구리에 직접 투자할 수 있는 ETF가 있나요?
있다. 대표적으로 Global X Copper Miners ETF (COPX)가 있다. 구리 광산 기업들에 분산 투자하는 구조로, 구리 가격 상승과 광산 기업 실적이 동시에 반영된다. AI 투자 확대에 따라 구리가 전력망·냉각 인프라의 필수 자원으로 재평가받고 있으며, 2030년까지 구리 수요 증가분의 60%는 글로벌 전력 인프라 투자가 차지할 전망이다. 단, 광산주 특성상 개별 기업 리스크도 반드시 고려해야 한다.
결론: 인플레이션 헤지, 이렇게 짜면 된다
2026년 원자재 투자는 ‘금이냐 원유냐’ 같은 양자택일의 문제가 아니다. 지정학적 리스크, 달러 약세, AI 인프라 수요, 에너지 전환이라는 네 가지 파도가 동시에 원자재 시장을 밀어올리고 있다. 핵심은 코어(광주리형 원자재 ETF) + 새틀라이트(금 ETF + 구리 ETF)로 분산하되, 레버리지 상품과 선물 콘탱고 함정은 피하는 것이다.
내 개인적 원자재 포트폴리오 배분 예시 (참고용, 투자 권유 아님):
- 광주리형 원자재 ETF (PDBC): 40%
- 금 ETF (IAU): 30%
- 금광주 ETF (GDX): 15%
- 구리 광산 ETF (COPX): 15%
이걸 전체 포트폴리오의 10% 이내에서 가져가는 게 현실적이다. 나머지 90%는 여전히 주식·채권이 담당해야 한다. 원자재로만 포트폴리오 다 채우면 그건 헤지가 아니라 도박이다.
⭐ 에디터 종합 평점: 원자재 헤지 투자 전략 — 9/10
지금처럼 인플레이션과 지정학적 불안이 동시에 작동하는 시장에서 원자재 헤지를 모르고 주식만 들고 있다면, 그건 비 오는 날 우산 없이 산에 오르는 것과 같다.
에디터 코멘트 : “금 사면 됩니다”는 초보의 말이고, “PDBC + IAU + COPX 코어-새틀라이트 구성에 포트폴리오 10% 배분”이 2026년 진짜 실무 언어다. 단, 레버리지 ETF와 콘탱고 구간 선물 장기 보유는 계좌에 구멍을 뚫는 지름길이니, 이것만큼은 명심하고 들어가라.
📚 관련된 다른 글도 읽어 보세요
- Is Inflation Coming Back? A Hard Look at the Macro Forces Shaping 2026
- Global Debt Crisis & Financial Market Instability in 2026: What’s Really Happening and How to Protect Yourself
- 2026 인플레이션 추이 완전 분석 | 소비자물가 지금 어디쯤 왔을까?
태그: []